Download
1 / 23
250 likes | 557 Views
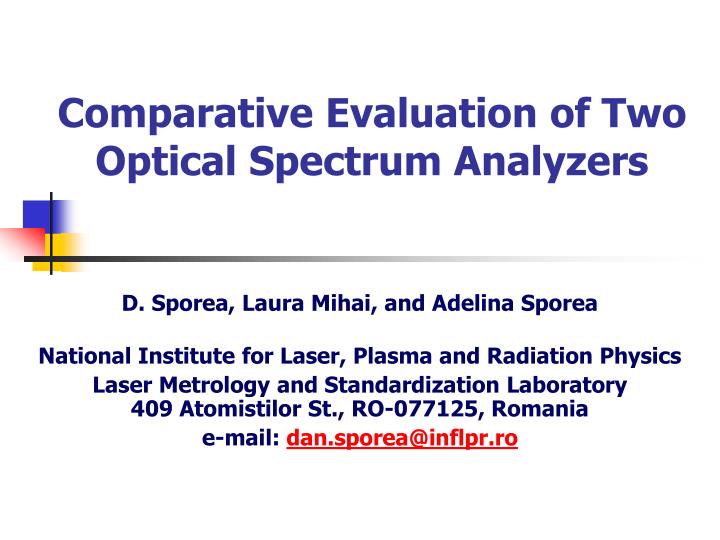
Comparative Evaluation of Two Optical Spectrum Analyzers. D. Sporea, Laura Mihai, and Adelina Sporea National Institute for Laser, Plasma and Radiation Physics Laser Metrology and Standardization Laboratory 409 Atomistilor St., RO-077125, Romania e-mail: dan.sporea@inflpr.ro. Overview .

E N D
Comparative Evaluation of Two Optical Spectrum Analyzers D. Sporea, Laura Mihai, and Adelina Sporea National Institute for Laser, Plasma and Radiation Physics Laser Metrology and Standardization Laboratory409 Atomistilor St., RO-077125, Romania e-mail: dan.sporea@inflpr.ro
Overview • Introduction • Objectives • Spectral response calibrations of the two OSAs • Optical power calibration of the two OSAs • Uncertainties sources identification and uncertainties budget • Comparative tests using the two OSAs (stability of laser sources power, channels drift, evaluation of the spectral transmittance for optical fiber systems passive components) • Conclusions
Introduction Optical spectrum analyzers (OSA) are key instruments in today quality assessment of passive and active components for optical communication systems, as well as for CWDM (coarse wavelength division multiplexing) and DWDM (dense wavelength division multiplexing) networks diagnostics. The main applications envisioned by OSAs on the components testing side are: • the characterization of light sources for optical communication applications (distributed feedback laser diodes – DFB-LD; Fabry–Perot laser diodes – FP-LD; LEDs); • the measurement of the spectral transmission width of pass band and notch filters; • the evaluation of the spectral attenuation of optical fiber links; • the polarization mode dispersion (PMD) in passive optical fiber components; • the evaluation of reconfigurable optical add/drop multiplexers (ROADMs) to be used as efficient deployment time and costs solutions for present DWDM networks and agile optical network (AON);
Objective In order to provide reliable measurement results, OSAs have to be calibrated for wavelength, optical power and spectral response. On the other side, each OSA has its own strengths and weaknesses in relation to a specific metrological task. Some OSAs have stronger processing functions for spectral analyzes of light sources; some others accommodate well the tests run on WDM systems. Our task was to assess the characteristics of two OSAs, a bench top one (for research applications) and a portable one (for field tests), through a comparative investigation of their capabilities.
Wavelength Calibrations Calibration Methods Set-up used
Wavelength Calibration Using the Reference Material 1 Calibration conditions: • All optical fibers have been checked and cleaned of any impurities before and after each disconnection. • All optical fibers were fixed to reduce the uncertainties due to fiber geometry changes. • For the calibration with reference material we chose the calibration interval corresponding to the specific reference cell: 1526 – 1566 nm for Hydrogen Cyanide H13C14N and 1560 nm – 1600 nm for Carbon Monoxide 12C16O and. • For the emission we used the internal source of the OSA. • The method of calibration consists in measuring the spectral response of reference material and then without reference material. The absorption lines were obtained as the difference between the two spectral curves.
Wavelength Calibration Using the Reference Material 2 The absorption spectra for two OSA calibration using cells H13N14.
Wavelength Calibration Using the Reference Material 3 The absorption spectra for the calibrations of the two OSAs using the CO12-C cell.
Wavelength Calibrations Using an External Light Source • We calibrated the OSAs at λ=1550.12 nm and λ=1310 nm, using two DFB laser diodes • We run10 tests for each wavelength.
Wavelength Calibration for 10 Channels, round 1 For the calibration with an external source we chose 10 channels from the ITU table corresponding to transmission channels at λ= 1550 nm (column 2). We run five tests for each selected wavelength, using a tunable source.
Wavelength Calibration for 10 Channels, round 2 We computed OSA deviation vs. the reference wavelength meter. For the calibration we used an tunable light source.
Optical Power Calibration We calibrated the optical power for the two OSAs at the reference power level equal to 100 mW and for λ=1550.12 nm. The reference power was kept fixed and 10 acquisitions were performed for the two OSAs.
OSA EXFO OSA ANDO Optical Power Linearity • The reference attenuation range that we chose was from -5 dB to -60 dB; • The calibration of the reference power meter is traceable to METAS. • The simple substitution method was used for data acquisition in the case of the two OSAs.
Short Term Stability To evaluate the wavelength and the optical power stability for 30 minutes (a short term) we used two reference equipments, traceable to METAS. We monitored the optical power stability at the reference level of 100 mW, and the wavelength stability for two channels: λ=1550.12 nm and λ=1310 nm.
Short Term Stability We measured for the calibrated equipments the spectral response and optical power short term stability (30 min.) at λ=1550 nm. Wavelength stability : OSA EXFO: s = 0.5021 pm and for OSA ANDO: s = 14.3 pm. Optical power stability: OSA EXFO: s = 0.0261 dBm and for OSA ANDO: s = 2.8054 dBm.
Polarization Dependency • 5 tests with two different OSAs • 10 minutes per test • Scanning rate: 10 sec. • The polarization scrambler was set for 60 scan/sec, to pass through all Poincare states. • l=1550 nm
OSA ANDO OSA EXFO Optical Power Dependency on the Wavelength
Spectral Density We measures the spectral density for a LED source: Ando – green, EXFO - red.
ANDO The Optical Transmittance of Passive Components Using two different OSAs, we measured the optical transmission of three passive components: a gamma irradiated beam splitter, an non-irradiated beam splitter and a gamma irradiated optical attenuator. EXFO
The Optical Transmittance of a Reference Optical Fiber We measured the transmittance through a reference optical fiber using the two OSAs. OSA ANDO OSA EXFO
ANDO EXFO The channel drift
Conclusions • The procedures for the power and wavelength calibration of the OSAs were developed • Three calibration set-ups were developed for the wavelength calibration of OSAs • The optical power and wavelength linearity for two OSAs was assessed • A comparative study of the wavelength and power short term stability, the channel drift and the polarization dependence of the detected optical power was carried out for two OSAs • The two equipments were used for a comparative evaluation of the spectral density of LEDs sources, the optical transmission of passive different optical components • Spectral responsivity calibration of the two OSAs was done by using as a reference material a standard optical fiber developed at METAS
References • Calibration of optical spectrum analyzers, IEC 62129 Ed. 1.0 b:2006. • Reference Guide to Fiber Optic Testing, Vol.1, 2007. • Guide to WDM Technology Testing, 2000. • Certificate of Analysis – Standard Reference Material 2514, NIST, 2002. • Certificate of Analysis – Standard Reference Material 2519a, NIST, 2005. • White Paper: In-service Measurement of the OSNR in ROADM-based Networks, JDSU, 2005. • Pocket Guide: Dense Wavelength Division Multiplexing, JDSU. • Sarah L. Gilbert, William C. Swann, and Tasshi Dennis: “Wavelength control and calibration for wavelength division multiplexed optical communication”, in the proceedings of the 2001 IEEE International Frequency Control Symposium, pp. 122-126 . • Igor Vayshenker, Xiaoyu Li and Thomas R. Scott: “Optical power meter calibration using tunable laser diodes”, 1994 hJCSLWorkshop & Symposium. • EXFO Electro-Optical Engineering Inc.: “Technical Note 019:Testing PMD in Fibers Using the FPMD-5600 Femtosecond PMD Analyzer”, 2002. • EXFO Electro-Optical Engineering Inc. :”Testing with LED source”, 2005. • EXFO Electro-Optical Engineering Inc.: “Optimizing the selection of your optical 129 spectrum analyzer”, 2005. • EXFO Electro-Optical Engineering Inc.: “CWDM and dwdm testing in the field using broadband sources and an OSA”, 2005.