Download
1 / 38
380 likes | 474 Views
Economy-Wide Simulations of MDG Strategies: Approach and Lessons from Ethiopia. Hans Lofgren Carolina Diaz-Bonilla DECPG World Bank Presentation prepared for AFRCE and AFR PREM Breakfast Seminar, World Bank, October 18, 2005. Introduction.

E N D
Economy-Wide Simulations of MDG Strategies: Approach and Lessons from Ethiopia Hans Lofgren Carolina Diaz-Bonilla DECPG World Bank Presentation prepared for AFRCE and AFR PREM Breakfast Seminar, World Bank, October 18, 2005
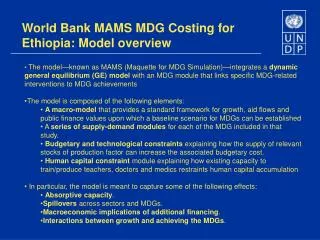
Introduction • For SSA, achieving the MDGs is a difficult challenge. • Key policy questions for MDG strategies: • What is the required expansion of public spending (level, composition)? • What are the effects on the labor market, foreign trade and exchange rates? (absorptive capacity?) • What are the roles of synergies between different MDGs? • How does growth in private incomes interact with public spending? • How do the effects depend on the mix between domestic and foreign financing? • What is the impact of back- and front-loading public service expansion? • If all MDGs cannot be met, what are the trade-offs between human development (HD) and infrastructure?
Introduction • In many SSA countries, the pursuit of MDGs major economic shock (macro, sectors, labor market, foreign aid). • Our approach: MAMS (Maquette for MDG Simulations) – an extended, dynamic-recursive computable general equilibrium (CGE) model designed for MDG analysis • Pilot study of Ethiopia.
Introduction • Rationale for approach: • Partial equilibrium analysis is insufficient – needs to be complemented by an economywide perspective • Agents do not act with perfect foresight. • Extensions required given that standard CGE models do not capture the output side of government spending.
Introduction • Contents of presentation: • Model structure • Data and resource requirements • Illustrative findings for Ethiopia • Lessons for other SSA countries • Next steps
2. Model structure • Ancestry: IFPRI standard model (Lofgren, Harris and Robinson); dynamic-recursive version. • Most features are familiar from other open-economy, dynamic-recursive CGE models: • Optimizing producers and consumers. • Supply-demand balance in factor and commodity markets (with flexible prices clearing most markets) • Expenditures = receipts for the three macro balances: government, savings-investment, rest of world • Imperfect transformation/substitutability in trade. • Updating of factor and population stocks and TFP; endogenous/exogenous mix.
2. Model structure • MAMS treatment of government: • It purchases government services, disaggregated by function. • Government services produced using labor, intermediate inputs, and capital. • Government services enter MDG/HD functions and influence factor productivity. • Education influences size and composition of labor force. • Additional spending items: interest payments, domestic transfers. • Alternative sources of government receipts: taxes, domestic borrowing, foreign borrowing, and foreign grants.
MDG/HD module • Functional forms across MDGs: • Top: MDG(-related) indicator = logistic(intermediate variable) • Bottom: intermediate variable = CE (gov services, other arguments) [CE = constant-elasticity] • Logistic function • calibrated to replicate base values under base conditions and to achieve MDG under conditions identified by sector studies. • diminishing marginal returns to increases in intermediate variable (and its determinants)
Education • Disaggregated by cycle. • Model tracks evolution of enrollment in each cycle = old students that continue/repeat + entering graduates from earlier cycle + new entrants to school system. • Endogenous student behavior: shares of relevant totals that graduate, continue, repeat, drop out; selected shares sum to unity. • Within each cycle and between cycles, student behavior determined by the above logistic-CE structure (for arguments, see MDG2 in Table)
Labor • In each year, labor by level of educational achievement defined as the sum of: • Remaining stocks from last year • New entrants among graduates and dropouts • Net entrants from outside the school system
Poverty and Inequality • Alternative approaches to poverty and inequality analysis: • aggregate poverty elasticity • representative household • microsimulation (integrated, top-down)
Other stocks and productivity • Updating of (non-labor) factor stocks: • private and government capital • non-capital factors with exogenous growth • Updating of debt stocks: • foreign (incl. possible debt relief) • domestic government • TFP (by production activity) as a function of • changes in public infrastructure services • changes in openness (trade share in GDP) • exogenous trend
Typical Ethiopia macro closures • Government balance: • Cleared by foreign grants • Given values: domestic and foreign borrowing, tax rates, government demand (consumption and investment), interest • Private savings-investment balance: • Cleared by private investment • Given values for funding sources: sum of private savings (net of lending to government), FDI, and private foreign borrowing (both exogenous) • RoW balance: • Cleared by real exchange rate (influencing exports and imports) • Given values: foreign borrowing, FDI, migrant remittances, and foreign grants
3. Data and resource requirements • Data Requirements • Social Accounting Matrix • Core Data • Non-Core Data • Technical Data • Resource Requirements
Social Accounting Matrix (SAM) • Country database • Required for every country application • How to begin? • Determine Base year • By data availability and context • As recent as possible, but avoid unstable year (drought, war, etc) • Create Macro SAM • Disaggregate into Micro SAM • Various sources and levels of disaggregation
Social Accounting MatrixMacro SAM • Construct up-to-date Macro SAM: • National Accounts Data • Balance of Payments • Government Budget • May include the following accounts: • activity, commodity, factor, household, government, rest-of-world, different tax accounts, domestic interest payments, foreign interest payments, private investment, public investment. • The RMSM-X model includes the data required.
Social Accounting MatrixMicro SAM • Disaggregation of the government and MDG-related accounts: • Education • Health • Water & Sanitation • Public Infrastructure • Other Government Services. • Need information on: • Recurrent Costs (intermediates and factor payments) • Investment Costs
Micro SAM (cont) • Activities-Commodities: MDG/government • Disaggregation should permit a distinction between the major determinants of the achievement of each MDG • For MDGs covered by the analysis • In effect in the areas of education, health, and water-sanitation • Educational coverage has to be comprehensive • Must cover the targeted primary school cycle and some aggregation of other schooling. • The schooling system is linked to the labor market: more disaggregation permits more detailed links between the labor market and educational MDGs
Micro SAM (cont) • Disaggregation of non-government/non-MDG-related accounts • Ex: activities/commodities, factors, households • Not required • But disaggregation would enrich the analysis • Analyze the MDGs in the context of a broader set of issues (e.g. trade) • With deeper insights about poverty (MDG1) • Only feasible if: • Relatively recent SAM exists, OR • Major data collection effort is to be undertaken • SAM-balancing program may be used to reconcile data from different sources and years.
Micro SAM (cont) • Factors • Disaggregation is flexible • Require at least one non-government/MDG capital type. • National accounts do not typically assign value-added to government capital • Labor disaggregated by the highest cycle achieved. • Institutions and related accounts (taxes, interest payments) • Model assumes single accounts for RoW and government • Households: one or more. • One or more enterprises may or may not be singled out.
Micro SAM (cont) • Required accounts for savings-investment • savings and capital (investment-financing) accounts by institution • one account per investment type (private and different public) • If private sector is involved in MDG-related health and education services, private activities/commodities and related capital returns and investment financing could be singled out.
Core Data • Essential for every country application • Covers the MDGs, education, population, labor, and selected government data (complementing the SAM). • Education data disaggregated by cycle. • Must distinguish the primary cycle corresponding to MDG 2.
Core Data (cont) • Includes more detailed data related to different MDGs and the labor market; ex: • Levels of service delivery to meet MDGs • Initial stocks of students by cycle • Initial stocks of labor by educational level • Student behavioral patterns (ex: graduation rates) • Labor use by activity (private and public)
Non-Core Data • Country-specific data collection effort is not essential. • Primarily future projections and some detailed data that are based on assessments. • Example: • Projected annual growth in macro aggregates, labor stocks (by type and household). • Assumed paths for exogenous parameters (borrowing, transfers)
Technical Data • Elasticities in production, trade, consumption, and in the different MDG functions. • Difficult to find country-specific estimates. • Disaggregation depends on the SAM disaggregation • Country-specific data collection effort is not essential. • Essential to identify technical studies that have generated or used this type of data (e.g. various other models of the economy and/or MDG sectors).
Data Sources • Public Expenditure Review (PER) • Country Economic Memoranda (CEM) • Development Policy Review (DPR) • World Development Indicators (WDI) • Labor stocks; Value-added in Ag/Ind/Srv; Pop • Country-specific research papers • Specialized sector studies • Health, education, water-sanitation, public infrastructure • Often undertaken in context of MDG studies.
Other Resource Requirements • People • Person knowledgeable about GAMS and CGE models. • Sectoral experts. • Time • 3 months for a country case study (?) (benefiting from initial investment in Ethiopia model)
4. Illustrative findings for Ethiopia • Evolution over Time: • Net Primary School Completion Rate (MDG 2; %) • Wages of Workers with Secondary-School Education (ET Birr) • Foreign Aid Per Capita (US$) • Trade-Offs between Human Development (HD) and Poverty
Evolution over Time for MDG 2Net Primary School Completion Rate (%)(By Simulation) Note: 2015 target for MDG 2 = 100%
Evolution over Time for WagesWorkers with Secondary-School Education(By Simulation) Note: Wages are shown in Ethiopian Birr
5. Lessons for other SSA countries • Initial investment has been made new applications need less resources. • Model disaggregation and related data needs are flexible and country-specific. • At least one team member must have expertise in GAMS-based CGE modeling
5. Lessons for other SSA countries • MAMS is a research tool, requiring development of a sector/micro-based database and a process of model fine-tuning/validation. • Government may prefer to use simpler macro frameworks for their strategy documents (political spending figures; implicit/different micro foundations) • MAMS findings provide background and can be used for Bank dialogue on the design of strategies for MDGs and poverty reduction.
6. Next Steps • Applications to additional countries under way (especially SSA and Latin America) • Streamlining of modeling framework • Training • Further development of documentation • User-friendly interface.
References • Lofgren, Hans, Rebecca Lee Harris, and Sherman Robinson, with assistance from Moataz El-Said and Marcelle Thomas. 2002. A Standard Computable General Equilibrium (CGE) Model in GAMS. Microcomputers in Policy Research, Vol. 5. Washington, D.C.: IFPRI (www. ifpri.org/pubs/microcom/micro5.htm) • Lofgren, Hans. 2004. MAMS: An Economywide Model for Analysis of MDG Country Strategies. Mimeo. November. Washington, D.C.: World Bank. • Lofgren, Hans and Carolina Diaz-Bonilla. 2005. “Economywide Simulations of Ethiopian MDG Strategies,” DECPG, World Bank, July.
References • Robinson, Sherman and Hans Lofgren. 2005. “Macro Models and Poverty Analysis: Theoretical Tensions and Empirical Practice,” Development Policy Review, Volume 23, Number 3, May. • Sundberg, Mark, and Hans Lofgren. 2005. Absorptive Capacity and Achieving the MDGs: The Case of Ethiopia. World Bank. Mimeo.