Download
1 / 26
260 likes | 413 Views
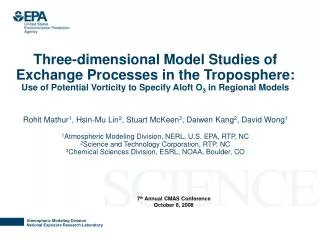
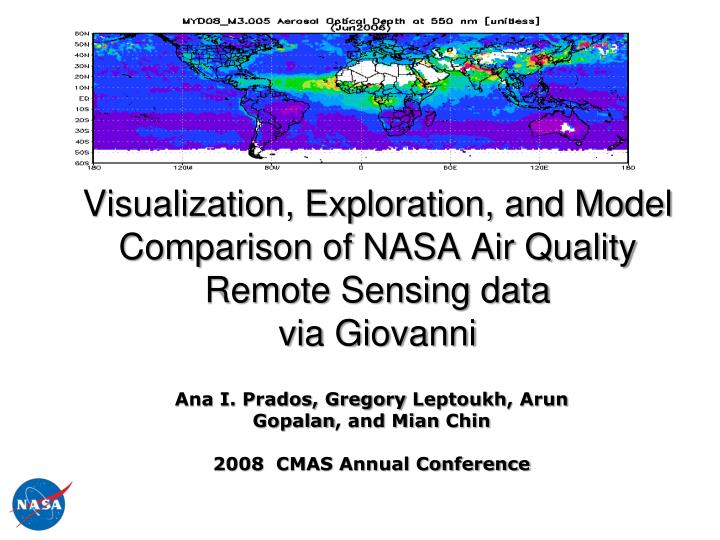
Visualization, Exploration, and Model Comparison of NASA Air Quality Remote Sensing data via Giovanni. Ana I. Prados, Gregory Leptoukh , Arun Gopalan , and Mian Chin 2008 CMAS Annual Conference. About Giovanni.

E N D
Visualization, Exploration, and Model Comparison of NASA Air Quality Remote Sensing data via Giovanni Ana I. Prados, Gregory Leptoukh, ArunGopalan, and Mian Chin 2008 CMAS Annual Conference
About Giovanni • Giovanni is a Web-based application developed by the NASA Goddard Earth Sciences Data and Information Services Center (GES DISC). • Giovanni provides a simple and easy way to explore, visualize, analyze, and access vast amounts of Earth science remote sensing and model data. • http://giovanni.gsfc.nasa.gov/
Giovanni at your Finger Tips • Only a Web browser is • needed. • No need to learn data formats and programming. • No need to download large amounts of data. • Customized data and analyses can be obtained with only a few mouse clicks.
Giovanni Air Quality Satellite data Giovanni Surface monitor data Model data Visualization: maps, curtain plots Data Analysis: time series, scatter plots, correlation plots Students Public Scientists, air quality forecasters & other professionals Policy Makers
AIRS MODIS 10-6 ppmv Aerosol from GOCART model MISR Parasol CloudSat CALIOP TOMS OMI MLS HIRDLS HALOE TRMM AMSR-E SeaWiFS Giovanni Tools Data Inputs Particulate Matter (PM 2.5) from AIRNow Aerosol from MODIS and GOCART model Carbon Monoxide from AIRS Giovanni Instances Models and more… Ozone Hole from OMI Water Vapor from AIRS MODIS vs SeaWiFS Chlorophyll
OMI Tropospheric NO2 Column • Sensitive in the Boundary layer • Qualitative agreement with high NOx regions (i.e urban areas)
MODIS Aerosol Optical Depth • At least two daily observations - Terra and Aqua • Sensitive to Boundary Layer Industrial, smoke & dust aerosols • Well validated over land • Fine mode fraction
OMI UV Aerosol Index • Mostly sensitive to absorbing aerosols above the planetary boundary layer (i.e transported smoke plumes)
Giovanni AIRNow PM2.5 Gridded Data Giovanni PM2.5 Map (ug/m3) • Giovanni PM2.5 map Data from EPA AIRNow. Acquired from DataFed via WCS. AIRNow PM2.5 Air Quality Index Map
Vertical Distribution of Aerosols & 3D-Vis Most Giovanni data sets available in KML (Google Earth, and other tools) July 31st, 2007 AIRNow PM2.5 map in background Vertical: Calipso Curtain Plot Yellow: aerosol flag Blue: cloud flag
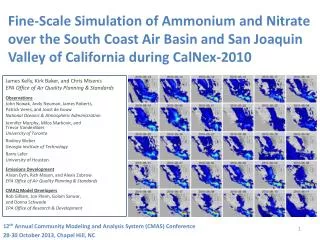
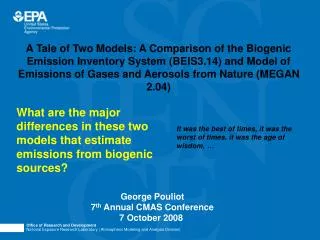
NASA Gocart Model Particle Speciation • Global chemical transport model with gas phase and aerosol chemistry • Daily and Monthly data at 2x2.5 degree resolution • Giovanni allows colocation with satellite and EPA AIRNow data • Source attribution for pollution events California and Southwestern US Eastern US Sea salt Organic CarbonDustBlack carbonSulfate
NASA GOCART Model Particle Speciation Sulfate Black Carbon Organic Carbon Dust
Examples of Giovanni capabilities for exploration and visualization of Global and US Air Quality
Air Pollution over China: MODIS AOD via Giovanni July 4th – August 4th, 2008 August 5th – August 25th, 2008 Beijing Summer 2008 Beijing Summer 2007
PM2.5, MODIS and OMI Views of California Fires OMI UV Aerosol Index EPA AIRNow PM2.5(ug/m3) Level-3 MODIS AOD Oct. 24th Oct. 25th
Aerosol Pollution over the Eastern US: haze or clouds ? MODIS Terra True Color imagery
Aerosol Pollution over the Eastern US? • Mixture of Haze and cloud over the Northeast
Haze over the Eastern US: Surface monitor and satellite data – July 7th, 2006 OMI Aerosol Index Moderate PM2.5 Smoke AIRNow PM2.5 MODIS AOD
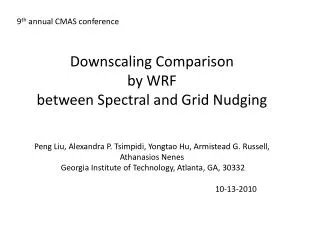
Monitor-Satellite ComparisonsJune 15- July 15th, 2006 MODIS/PM2.5 correlation MODIS/PM2.5 time series Satellite data is a total column --- not necessarily correlated with PM2.5 concentrations
Aerosol Pollution on July 7th: industrial (sulfate) or smoke ? Gocart Model July 7th – relatively high organic and black carbon over eastern US Organic Carbon Black carbonSulfate
Aerosol Pollution over the Eastern: Gocart Model data via Giovanni Sulfate Organic Carbon Black carbonSulfate Organic Carbon
Coming Soon to Giovanni…. • HTAP Model Data • Meteorological and chemical speciation data from models for examining long range transport of pollutants • Comparisons among satellite, model, and in-situ air quality data
How can I learn more about NASA Earth Science data and Giovanni ?? • AMS 2009 – 1 Day Giovanni workshop • More workshops in 2009 on NASA Earth Science data sets and tools, including Giovanni
Giovanni Air Quality Tools and Datasets Available Science Data Sets • PM2.5 station data - Acquired at DataFed from EPA AIRNow and then via WCS into Giovanni • MODIS TERRA and AQUA total and fine mode Aerosol Optical Depth • CALIOP Aerosol Feature Mask curtain plots • OMI UV Aerosol Index • OMI NO2 Tropospheric column (0.25x0.25 degree) • Gocart Model data – AOD speciation (2x2.5 degree) • AIRS CO, methane Useful Tools for Air Quality Applications • AOD/ PM2.5 scatter plots, correlation maps, time series and difference plots • AOD and PM2.5 loops for examining long range transport of aerosols
NASA GOCART Model Particle Speciation Sea salt Organic CarbonDustBlack carbonSulfate North-Central US Southeastern US Texas