Download
1 / 16
160 likes | 324 Views
Laurel Saito 1,2 , Franco Biondi 2,3 , Jasmine Vittori, 1,2 Rajan Devkota, 1,2 Jose Salas 4 1 Department of Natural Resources and Environmental Science, University of Nevada Reno (UNR) 2 Graduate Programs of Hydrologic Sciences and Environmental Science, UNR

E N D
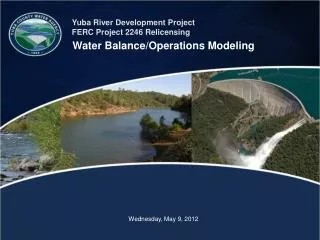
Laurel Saito1,2, Franco Biondi2,3, Jasmine Vittori,1,2 Rajan Devkota,1,2 Jose Salas4 1Department of Natural Resources and Environmental Science, University of Nevada Reno (UNR) 2Graduate Programs of Hydrologic Sciences and Environmental Science, UNR 3DendroLab, Department of Geography, UNR 4Department of Civil and Environmental Engineering, Colorado State University Water Balance Modeling with Tree-Ring Records to Improve Water Resource Variability Estimation
Introduction Approach Results Future work Outline
Water in the west • Limited water • Limited data • Climate trends important Timing of peak streamflows based on observed data (Regonda et al. 2005) Timing of peak streamflows using GCM linked with VIC model (Hidalgo et al. 2009)
Traditional approaches • Multivariate regression with principal component analysis • Bivariate regression Tree Ring data and streamflows r2 = 0.63 Observed and reconstructed annual streamflow for 83 yrs of Williams Fork River, CO (Woodhouse and Lukas 2006) Reconstructed annual streamflow for upper Colorado, northern South Platte, and southern South Platte river basins (Woodhouse and Lukas 2006)
Partner mechanistic watershed model with tree-ring derived precipitation • Advantages • Sensitivity analysis can test uncertainties in predictions • Can examine influences of disturbance on past streamflows Dendrochronology and watershed models
Inputs must be proxy data from tree-rings • Precipitation • Air temperature • Time scale: annual or seasonal • Must be able to represent physical processes • Evapotranspiration • Infiltration • Runoff • Baseflow • Snowmelt (for seasonal model) Watershed Model requirements
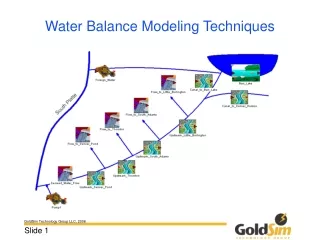
Walker River basin • Upstream of Coleville gage • 63 years of streamflows for calibration • 2300 yrs of proxy water-year precipitation (Biondi et al. 2008) Preliminary modeling Source: Saito et al. (2008)
Preliminary modeling - aNNUAL a = fraction of precipitation that becomes runoff b = fraction of infiltration that becomes evapotranspiration c = fraction of groundwater storage that becomes baseflow d = fraction of groundwater storage that becomes groundwater flow Note: c + d must be ≤ 1Time frame: Water year Evapo-transpiration b Using PRISM precipitation data, r2 = 0.87 Source: Saito et al. (2008) Precipitation Runoff Streamflow a c Baseflow GW Storage Infiltration GW Flow d Deep Percolation Source: K. Solander 2009
Investigated models • Temperature index model (Solander et al. 2008) • 7 parameters • Modeled wet season only • Thornthwaite water balance model (McCabe and Markstrom2007; Gray and McCabe 2010) • 7 parameters • Monthly time step • Water and Snow Balance Model (WASMOD) (Xu 2002) • 6 parameters • Weekly/monthly time step • Relative humidity Seasonal watershed models
Model A – Simple Model with WASMOD SNOW COMPONENT Air Temperature Model parameters: a, b, c, d = same as Saito et al. (2008) model s = temperature below which precipitation is snow w = temperature above which snow begins to melt Precipitation s ET Snow Snowmelt + Rain a w Snowpack Runoff Streamflow Infiltration b Baseflow c Deep Percolation GW Storage d GW Flow Adapted from Saito et al. (2008) and Xu, 2002 Simple model with WASMOD snow component Air Temperature a = fraction of precipitation that becomes runoff b = fraction of infiltration that becomes evapotranspiration (ET) c = fraction of groundwater storage that becomes baseflow d = fraction of groundwater storage that becomes groundwater flow a1= temperature below which precipitation is snow a2= temperature above which snow begins to melt Precipitation a1 ET Snow Snowmelt + Rain a2 a Snowpack Runoff Streamflow Infiltration b Baseflow c Deep Percolation GW Storage d GW Flow Adapted from Saito et al. (2008) and Xu, 2002 Simple model with Thornthwaite snow component Air Temperature TR TS a = fraction of precipitation that becomes runoff b = fraction of infiltration that becomes evapotranspiration (ET) c = fraction of groundwater storage that becomes baseflow d = fraction of groundwater storage that becomes groundwater flow Ts= temperature below which all precipitation is snow Tr= temperature above which all precipitation is rain m = MeltMax, maximum snow melt rate Precipitation ET m Snowmelt + Rain Snow a Runoff Streamflow Infiltration b Baseflow c Deep Percolation GW Storage d GW Flow Adapted from Saito et al. (2008) and McCabe and Markstsrom (2007)
Model B – Simple Model with THORNTHWAITE SNOW COMPONENT Model parameters: a, b, c, d = same as Saito et al. (2008) model e = temperature above which all precipitation is rain f = temperature below which all precipitation is snow m = MeltMax; maximum snow melt fraction Air Temperature e f Precipitation ET Snowmelt + Rain Snow m a Runoff Streamflow Infiltration b Baseflow c Deep Percolation GW Storage d GW Flow Adapted from Saito et al. (2008) and McCabe and Markstrom (2007)
Model Aave • RMSE = 7.29 cm • r2 = 0.90 • %bias = 0.90% results – Best-Performing Model Source: Vittori (2011)
results – Parameter estimation No runoff! Source: Vittori (2011)
“Best” seasonal model for use with tree-ring data • Simple water balance model • WASMOD snow component • 6 parameters • Average seasonal temperatures results – MODEL INVESTIGATIOn
Improve methods of creating proxy precipitation and air temperature • Compare: • Model reconstructions with proxy data • Regression reconstructions • Investigate model sensitivities • Land use/land cover change • Climate scenarios • Apply model to other basins Future work
Biondi et al. (2008): Ecol. Model. 211:383-395 Gray and McCabe (2010): WRR 46:W05513 Hidalgo et al. (2009): J Climate 22:3838-3855 McCabe and Markstrom (2007): USGS OFR 2007-1088 Regonda et al. (2005): J Climate 18:372-384 Saito et al. (2008): Env Res Letters 3:024006 Vittori (2011): Master’s thesis, University of NV Reno Woodhouse and Lukas (2006): Climate Change 78:293-315 Xu (2002): Ch 17, Math. Models of Small WtrshdHydrol. And Applications. THANKS TO KURT SOLANDER, AND DENDROLAB References QUESTIONS?