Download
1 / 1
10 likes | 115 Views
INDUCED MOVEMENTS OF GIANT VESICLES BY MILLIMETER WAVE RADIATION Alfonsina Ramundo-Orlando 1* , Martina Albini 1 , Simone Dinarelli 2 , Stefania Romeo 3 , Emiliano Zampetti 4 , Marco Girasole 2 , Francesco Pennella 5 , Umberto Morbiducci 5 , Rita Massa 6

E N D
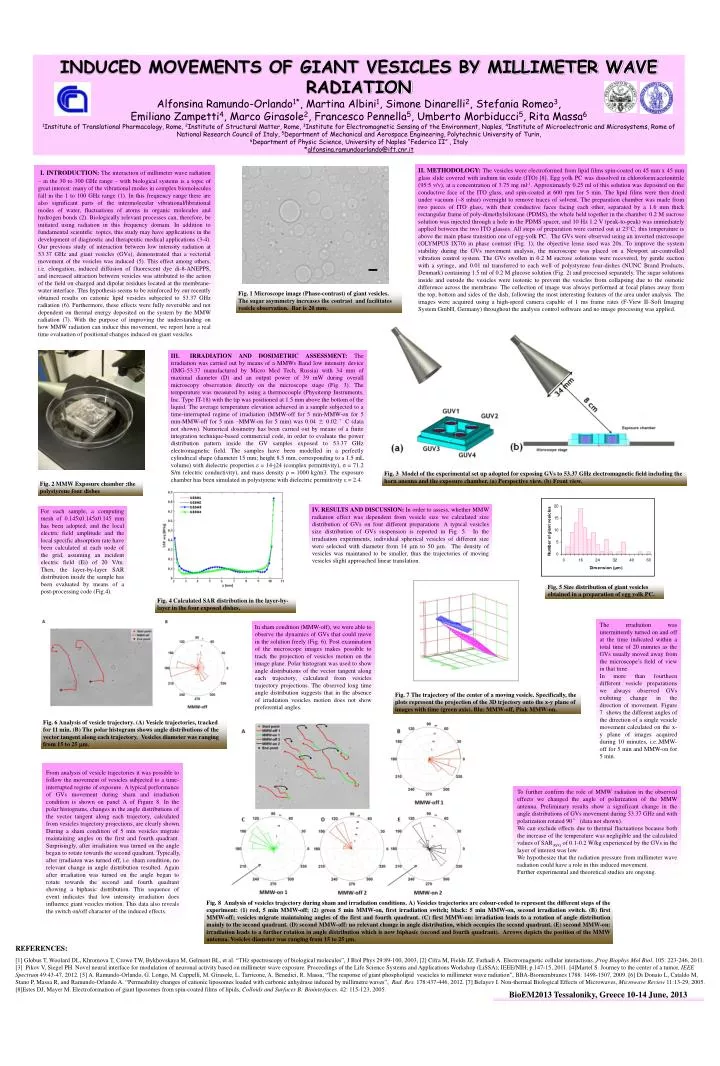
INDUCED MOVEMENTS OF GIANT VESICLES BY MILLIMETER WAVE RADIATION Alfonsina Ramundo-Orlando1*, Martina Albini1, Simone Dinarelli2, Stefania Romeo3, Emiliano Zampetti4, Marco Girasole2, Francesco Pennella5, Umberto Morbiducci5, Rita Massa6 1Institute of Translational Pharmacology, Rome, 2Institute of Structural Matter, Rome, 3Institute for Electromagnetic Sensing of the Environment, Naples, 4Institute of Microelectronic and Microsystems, Rome of National Research Council of Italy, 5Department of Mechanical and Aerospace Engineering, Polytechnic University of Turin, 6Department of Physic Science, University of Naples “Federico II” , Italy *alfonsina.ramundoorlando@ift.cnr.it II. METHODOLOGY:The vesicles were electroformed from lipid films spin-coated on 45 mm x 45 mm glass slide covered with indium tin oxide (ITO) [8]. Egg yolk PC was dissolved in chloroform:acetonitrile (95:5 v/v), at a concentration of 3.75 mg ml-1. Approximately 0.25 ml of this solution was deposited on the conductive face of the ITO glass, and spin-coated at 600 rpm for 5 min. The lipid films were then dried under vacuum (~8 mbar) overnight to remove traces of solvent. The preparation chamber was made from two pieces of ITO glass, with their conductive faces facing each other, separated by a 1.6 mm thick rectangular frame of poly-dimethylsiloxane (PDMS), the whole held together in the chamber. 0.2 M sucrose solution was injected through a hole in the PDMS spacer, and 10 Hz 1.2 V (peak-to-peak) was immediately applied between the two ITO glasses. All steps of preparation were carried out at 23°C; this temperature is above the main phase transition one of egg-yolk PC. The GVs were observed using an inverted microscope (OLYMPUS IX70) in phase contrast (Fig. 1); the objective lense used was 20x. To improve the system stability during the GVs movement analysis, the microscope was placed on a Newport air-controlled vibration control system.The GVs swollen in 0.2 M sucrose solutions were recovered, by gentle suction with a syringe, and 0.01 ml transferred to each well of polystyrene four-dishes (NUNC Brand Products, Denmark) containing 1.5 ml of 0.2 M glucose solution (Fig. 2) and processed separately. The sugar solutions inside and outside the vesicles were isotonic to prevent the vesicles from collapsing due to the osmotic difference across the membrane. The collection of image was always performed at focal planes away from the top, bottom and sides of the dish; following the most interesting features of the area under analysis. The images were acquired using a high-speed camera capable of 1 ms frame rates (F-View II–Soft Imaging System GmbH, Germany) throughout the analysis control software and no image processing was applied. I.INTRODUCTION: The interaction of millimeter wave radiation – in the 30 to 300 GHz range – with biological systems is a topic of great interest: many of the vibrational modes in complex biomolecules fall in the 1 to 100 GHz range (1). In this frequency range there are also significant parts of the intermolecular vibrational/librational modes of water, fluctuations of atoms in organic molecules and hydrogen bonds (2). Biologically relevant processes can, therefore, be initiated using radiation in this frequency domain. In addition to fundamental scientific topics, this study may have applications in the development of diagnostic and therapeutic medical applications (3-4). Our previous study of interaction between low intensity radiation at 53.37 GHz and giant vesicles (GVs), demonstrated that a vectorial movement of the vesicles was induced (5). This effect among others, i.e. elongation, induced diffusion of fluorescent dye di-8-ANEPPS, and increased attraction between vesicles was attributed to the action of the field on charged and dipolar residues located at the membrane-water interface. This hypothesis seems to be reinforced by our recently obtained results on cationic lipid vesicles subjected to 53.37 GHz radiation (6). Furthermore, these effects were fully reversible and not dependent on thermal energy deposited on the system by the MMW radiation (7). With the purpose of improving the understanding on how MMW radiation can induce this movement, we report here a real time evaluation of positional changes induced on giant vesicles. Fig. 1 Microscope image (Phase-contrast) of giant vesicles. The sugar asymmetry increases the contrast and facilitates vesicle observation. Bar is 20 mm. III. IRRADIATION AND DOSIMETRIC ASSESSMENT: The irradiation was carried out by means of a MMWs Band low intensity device (IMG-53.37 manufactured by Micro Med Tech, Russia) with 34 mm of maximal diameter (D) and an output power of 39 mW during overall microscopy observation directly on the microscope stage (Fig. 3). The temperature was measured by using a thermocouple (Physitemp Instruments, Inc. Type IT-18) with the tip was positioned at 1.5 mm above the bottom of the liquid. The average temperature elevation achieved in a sample subjected to a time-interrupted regime of irradiation (MMW-off for 5 min-MMW-on for 5 min-MMW-off for 5 min –MMW-on for 5 min) was 0.04 ± 0.02 °C (data not shown). Numerical dosimetry has been carried out by means of a finite integration technique-based commercial code, in order to evaluate the power distribution pattern inside the GV samples exposed to 53.37 GHz electromagnetic field. The samples have been modelled in a perfectly cylindrical shape (diameter 15 mm; height 8.5 mm, corresponding to a 1.5 mL volume) with dielectric properties ε = 14-j24 (complex permittivity), σ = 71.2 S/m (electric conductivity), and mass density ρ = 1000 kg/m3. The exposure chamber has been simulated in polystyrene with dielectric permittivity ε = 2.4. Fig. 3 Model of the experimental set up adopted for exposing GVs to 53.37 GHz electromagnetic field including the horn anenna and the exposure chamber. (a) Perspective view. (b) Front view. Fig. 2 MMW Exposure chamber :the polystyrene four dishes IV. RESULTS AND DISCUSSION: In order to assess, whether MMW radiation effect was dependent from vesicle size we calculated size distribution of GVs on four different preparations. A typical vesicles size distribution of GVs suspension is reported in Fig. 5. In the irradiation experiments, individual spherical vesicles of different size were selected with diameter from 14 m to 50 m. The density of vesicles was maintaned to be smaller, thus the trajectories of moving vesicles slight approached linear translation. For each sample, a computing mesh of 0.145x0.145x0.145 mm has been adopted, and the local electric field amplitude and the local specific absorption rate have been calculated at each node of the grid, assuming an incident electric field (Ei) of 20 V/m. Then, the layer-by-layer SAR distribution inside the sample has been evaluated by means of a post-processing code (Fig.4). Fig. 5 Size distribution of giant vesicles obtained in a preparation of egg yolk PC. Fig. 4 Calculated SAR distribution in the layer-by-layer in the four exposed dishes. The irradiation was intermittently turned on and off at the time indicated within a total time of 20 minutes as the GVs usually moved awayfrom the microscope’s field of view in that time. In more than fourtheen different vesicle preparations we always observed GVs exibitingchange in the direction of movement. Figure 7 shows the different angles of the direction of a single vesicle movement calculated on the x-y plane of images acquired during 10 minutes, i.e.,MMW-off for 5 min and MMW-on for 5 min. In sham condition (MMW-off), we were able to observe the dynamics of GVs that could move in the solution freely (Fig. 6). Post examination of the microscope images makes possible to track the projection of vesicles motion on the image plane. Polar histogram was used to show angle distributions of the vector tangent along each trajectory, calculated from vesicles trajectory projections. The observed long time angle distribution suggests that in the absence of irradiation vesicles motion does not show preferential angles. Fig. 7The trajectory of the center of a moving vesicle. Specifically, the plots represent the projection of the 3D trjectory onto the x-y plane of images with time (green axis). Blu: MMW-off, Pink MMW-on. Fig. 6 Analysis of vesicle trajectory. (A) Vesicle trajectories, tracked for 11 min. (B) The polar histogram shows angle distributions of the vector tangent along each trajectory. Vesicles diameter was ranging from 15 to 25 m. From analysis of vesicle trajectories it was possible to follow the movement of vesicles subjected to a time-interrupted regime of exposure. A typical performance of GVs movement during sham and irradiation condition is shown on panel A of Figure 8. In the polar histograms, changes in the angle distributions of the vector tangent along each trajectory, calculated from vesicles trajectory projections, are clearly shown. During a sham condition of 5 min vesicles migrate maintaining angles on the first and fourth quadrant. Surprisingly, after irradiation was turned on the angle began to rotate towards the second quadrant. Typically, after irradiaton was turned off, i.e. sham condition, no relevant change in angle distribution resulted. Again after irradiation was turned on the angle began to rotate towards the second and fourth quadrant showing a biphasic distribution. This sequence of event indicates that low intensity irradiation does influence giant vesicles motion. This data also reveals the switch on/off character of the induced effects. To further confirm the role of MMW radiation in the observed effects we changed the angle of polarization of the MMW antenna. Preliminary results show a significant change in the angle distributions of GVs movement during 53.37 GHz and with polarization rotated 90° (data not shown). We can exclude effects due to thermal fluctuations because both the increase of the temperature was negligible and the calculated values of SARAVG of 0.1-0.2 W/kg experienced by the GVs in the layer of interest was low. We hypothesize that the radiation pressure from millimeter wave radiation could have a role in this induced movement. Further experimental and theoretical studies are ongoing. Fig. 8 Analysis of vesicles trajectory during sham and irradiation conditions. A) Vesicles trajectories are colour-coded to represent the different steps of the experiment: (1) red, 5 min MMW-off; (2) green 5 min MMW-on, first irradiation switch; black: 5 min MMW-on, second irradiation switch. (B) first MMW-off; vesicles migrate maintaining angles of the first and fourth quadrant. (C) first MMW-on: irradiation leads to a rotation of angle distribution mainly to the second quadrant. (D) second MMW-off: no relevant change in angle distribution, which occupies the second quadrant. (E) second MMW-on: irradiation leads to a further rotation in angle distribution which is now biphasic (second and fourth quadrant). Arrows depicts the position of the MMW antenna. Vesicles diameter was ranging from 15 to 25 m. REFERENCES: [1] Globus T, Woolard DL, Khromova T, Crowe TW, Bykhovskaya M, Gelmont BL, et al. “THz spectroscopy of biological molecules”, J Biol Phys 29:89-100, 2003, [2] Cifra M, Fields JZ, Farhadi A. Electromagnetic cellular interactions.,Prog Biophys Mol Biol. 105: 223-246, 2011. [3] Pikov V, Siegel PH. Novel neural interface for modulation of neuronal activity based on millimeter wave exposure. Proceedings of the Life Science Systems and Applications Workshop (LiSSA); IEEE/NIH; p.147-15, 2011. [4]Martel S. Journey to the center of a tumor, IEEE Spectrum 49:43-47, 2012. [5]A. Ramundo-Orlando, G. Longo, M. Cappelli, M. Girasole, L. Tarricone, A. Benedici, R. Massa, “The response of giant phospholipid vescicles to millimeter wave radiation”, BBA-Biomembranes 1788: 1498-1507, 2009. [6] Di Donato L, Cataldo M, Stano P, Massa R, and Ramundo-Orlando A. “Permeability changes of cationic liposomes loaded with carbonic anhydrase induced by millimetre waves”, Rad. Res. 178:437-446,2012. [7] Belayev I. Non-thermal Biological Effects of Microwaves, Microwave Review 11:13-29, 2005. [8]Estes DJ, Mayer M. Electroformation of giant liposomes from spin-coated films of lipids, Colloids and Surfaces B: Biointerfaces. 42: 115-123, 2005. BioEM2013 Tessaloniky, Greece 10-14 June, 2013