Download
1 / 20

E N D
During the lifetime of the excited state of CFP an energy field is created by the oscillation of the excited state electron. YFP can be excited through resonance with this energy field. For the transfer of energy to occur the fluorophore to fluorophore distance must be within approximately 100 angstroms. The distance requirement is described by the Forster equation for the efficiency of transfer: Given that the Ro for the CFP-YFP combination is 49 angstroms: In practice we have found that the fluorophore to fluorophore distance must be less than 70 angstroms to be detected by our methods.
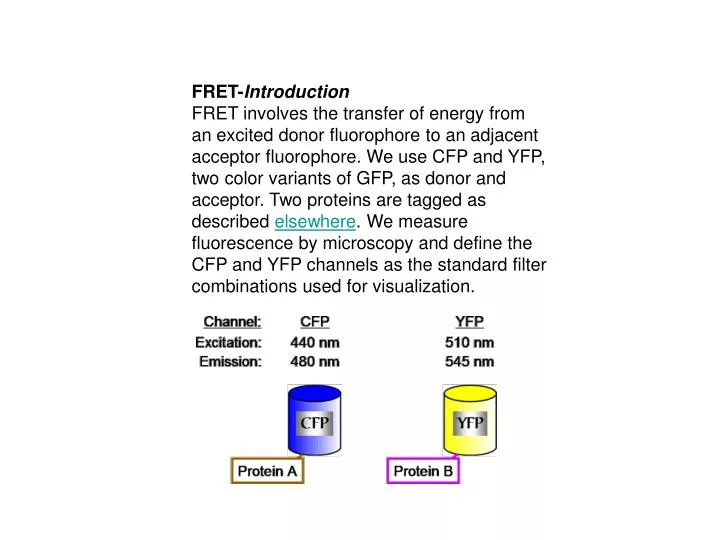
To examine FRET between two tagged proteins CFP is excited with CFP excitation filter and the emission from YFP is captured using the YFP emission filter. We call this filter combination the FRET channel.
There are two problems that are encountered when using CFP and YFP as FRET partners. First the FRET channel is polluted with fluorescence spilling over from CFP. Even when CFP is expressed alone a certain amount of fluorescence is observed in the FRET channel. However we quantify the amount of fluorescence in the FRETchannel when CFP is expressed alone and define a spillover factor:
In addition the FRET channel is polluted by some direct excitation of YFP. Just as in the case with CFP, even when YFP is expressed alone a certain amount of fluorescence is observed in the FRET channel. Again, we quantify the amount of fluorescence in the FRETchannel when YFP is expressed alone and define a spillover factor:
Let's return to the FRET experiment: We have two proteins tagged with YFP and CFP and co-expressed in the cell. We acquire images from the 3 channels in the order shown. In practice we have found that the order of acquisition is important because YFP rapidly bleaches when exposed to the CFP excitation light. From the CFP and YFP channel data we calculate the total fluorescence expected in the FRET channel from spillover: FRET is then measured as the relative increase in the FRET channel over the expected background from spillover: If there is no FRET then FRETR is 1. The maximum FRETR we have observed is approximately 2.5 for positive controls in which a protein is tagged with CFP and YFP in tandem using plasmid pDH18.
Microscope Base: Set up for Differential Interference Contrast (DIC) Observation • Objectives: UPlanApo/100X 1.35 Oil; UPlanApo/60X 1.40 Oil • Immersion Oil: Applied Precision, N=1.514 • Camera:Photometrics CoolSNAP HQ , Hammatsu Orca II • Light Source: OSRAM HBO 100W/2, Mercury Short Arc Lamp. We replace the lamp when it has more than 100-150 hours of usage or the YFP photosensor values are less than 550,000. • Excitation Filters: XF1071 (440AF21); XF1068 (500AF25) • Emission Filters: XF3075 (480AF30); XF3074 (545AF35) • Dichroic: XF2065 (436-510DBDR) • All filters from Omega Optical or Chroma • Temperature Controlled Growth:Bioptechs Objective Heater and Controller Model FCS2, Closed Chamber System Controller, Model FCS3. Typically live cells are kept at room temperature. The Bioptechs controllers are used for temperature-sensitive mutants where temperature needs to be tightly regulated. We use the 60X objective with the protective sleeve removed for this purpose.
We tag proteins with CFP and YFP using the procedure described elsewhere on the web site. The tagged proteins are expressed under the control of their own promoter. They fully replace the wild-type, untagged protein. There is no wild-type gene. This means that for an essential protein the tagged version is functional. On the day before image acquisition, fresh cells are plated on YPD supplemented with 3X adenine and grown at 30 C. The addition of extra adenine eliminates the red pigment that would otherwise accumulate in our ade2 strains. The next day colonies the size of pin heads are scraped up together and resuspended in 30 ul of SD media. There is no need for sonication before visualization since cell separation is complete under these conditions. A 3 ul aliquot is placed on a 1% SDC low melt agarose pad on a microsope slide. The preparation of the slide is presented on the next few pages.
Before proceeding with our general acquisition parameters several properties of YFP and CFP need to be introduced. First, CFP and YFP photobleach much more rapidly than GFP. After six repetitions of 0.25 second exposures (a total of just 1.5 seconds!) CFP fluorescence is reduced 50%. YFP is more stable, as it takes 6.5 seconds of total exposure to diminish the signal intensity to 50%. The rapid photobleaching of CFP requires that exposure times be kept to a minimum. In practice we have found that in FRET experiments 0.4 second exposure times are optimum. The only exception is for very bright signals where the exposure times can be reduced further. The other practical point is that fluorescence is never examined by eye before acquisition by the camera.
One other property of YFP dictates the order of image acquisition. YFP is rapidly photobleached when excited with the CFP excitation energy. Thus in our FRET experiment YFP must be imaged first, followed by the FRET channel (CFP excitation, YFP emission) and finally the CFP channel.
The precise details for acquistion will depend on the microscope. We illustrate with screen captures from our DeltaVision microscope running Softworx. Our typical experimental protocol is shown here. We image with the 100X objective, the camera is set for 2 x 2 binning, 3 sequential 0.4 second exposures capture the YFP, FRET and CFP channels and finally a 0.05 second DIC image is captured.
Just as for image acquisition, the details for image analysis will depend on the image analysis software. We demonstrate our analysis using the Softworx program that is part of our DeltaVision system. The first step is to determine the Spillover factors described in the Introduction. This is accomplished by imaging two strains in which one of your proteins of interest is tagged with either YFP or CFP alone. For example we demonstrate how we determined the YFP Spillover factor for a spindle pole body (SPB) component. In the image below, Spc110 is tagged with YFP. No other fluorescent protein is labeled. We had run the FRET acquisition series and acquired 4 bundled images, just as if we were examining FRET between a pair of proteins. In the left strip the depressed and highlighted "545" button displays the YFP channel. The Data Inspector panel allows us to create a 5 x 5 pixel box that encompasses the image of the SPB. The pixel intensity data is saved to a space delimited text output file.
The next step is to select an appropriate 5 x 5 pixel background box. The choice of a background region is a critical step. In the case of the SPB we first examine the DIC image, below, to orient the position of the selection box. The background region will be an adjacent square within the cell, as shown in the next web page. If the protein had a diffuse nuclear pattern, an adjacent region in the cytoplasm would be chosen. The most challenging case is a signal that is present throughout the cell. In that case we mix in isogenic cells without a label and use a region in an adjacent cell as background. The choice of background requires your best judgement. One check on the choice of background is that a negative control for FRET will have a FRETR value different from the expected value of 1.00.
The process of collecting a YFP image, a YFP background image, a FRET image and a FRET background image is repeated approximately 60 times. With as little as 40 separate data points a reasonable average value can be calculated, but in general 60 narrows the standard deviation. In the end a text file is generated that will have all the data for the objects (in this case 60 different SPBs) in groups of 4, as shown, in part, below.
The data text file is manipulated to remove extraneous data and restructure the format to yield the following Microsoft Excel spreadsheet. We have created a Perl script to automate the process for our DeltaVision files. The Perl script will be available soon. However the manipulations can also be done through basic cutting and pasting in a word processor program and Excel. Columns A - D are the sum of the intensity values in the 5 x 5 pixel box. The YFP and FRET columns are the background subtracted total intensity values. YFP Spillover factor is calculated by dividing the FRET values by the YFP values. The average and standard deviation are then computed.
The CFP Spillover factor is calculated in the same manner, except the YFP tag is replaced by CFP. How often to measure the Spillover factors? The factors will reflect changes in light intensity due to the age of mercury lamp, so it is a good idea to measure the spillover factors over the lifetime of the lamp. By tracking photosensor values and changing the bulb after 100 hours of use one can minimize the change in spillover factors, as well as keep the images bright. Once the factors are available FRETR can be evaluated.
In the FRET experiment two proteins are labeled, one with CFP and one with YFP. The FRETR value will indicate whether the fluorescent proteins are in close proximity and by implication the two tagged proteins are adjacent, i.e. within 70 angstroms. Image capture and and the initial analysis is the same as described in earlier web pages. A text file is created that has the intensity values for the YFP, YFP background, FRET, FRET background, CFP and CFP background. An example is shown in the next 2 pages.
FRETR is not a direct measure of the amount or efficiency of energy transfer. FRETR is a relative and empirical measure of energy transfer. FRETR equals the relative increase in the amount of light in the FRET channel when compared to an expected baseline determined from the fluorescence in the YFP and CFP channels. In order to best interpret FRETR one creates a positive control. The positive control is constructed with pDH18 and creates a strain in which one of the proteins of interest is fused to a tandem YFP-CFP tag. In practice we have found that FRETR for our positive controls are typically 2.50 with a 10 -15 % standard deviation. If an experimental pair of proteins yields a FRETR of greater than 2 than the proteins are in close proximity to each other. Of course, since FRETR is an empircal measure biased in part by fluorescence filters, camera specifications and the experimental set up, the value for the positive control may be higher or lower. What is the lower limit of detection? To push the sensitivity of FRETR one needs a carefully chosen negative control. This would be a pair of proteins which a priori one knows are too distant from each other (> 100 angstroms) to FRET. One can then verify that the methodology and spillover factors return the expected FRETR value of 1.00. In this case we have seen that FRETR values as low as 1.07 can represent energy transfer. In the absence of negative controls certainly values of 1.20 and higher represent energy transfer, assuming a positive control of 2.5.