Download
1 / 31
310 likes | 331 Views
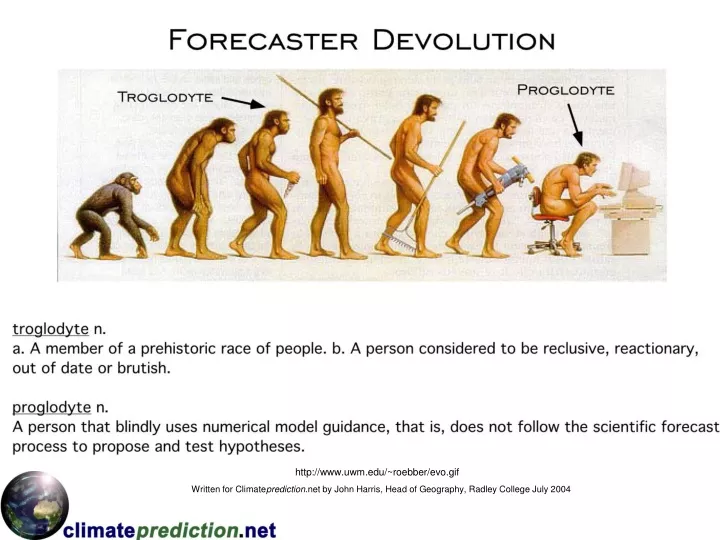
John. http://www.uwm.edu/~roebber/evo.gif. Written for Climate prediction .net by John Harris, Head of Geography, Radley College July 2004. Forecasting. Your aim is to learn more about:. different types of forecasting. how are forecasts made? why? how reliable are they?.

E N D
John http://www.uwm.edu/~roebber/evo.gif Written for Climateprediction.net by John Harris, Head of Geography, Radley College July 2004
Forecasting Your aim is to learn more about: different types of forecasting. how are forecasts made? why? how reliable are they?
Different forecasts • Apart from weather forecasts can you think of three other common forecasts? • predicted world population growth. • car ownership and demand for new roads. • energy production and consumption.
How is a forecast made? • study previous trends. • identify the key variables e.g. birth rate, death rate and migration. • consider likely changes in these variables over time e.g. increasing levels. of economic development may lead to higher rates of energy consumption.
Why is forecasting important? • Planning services e.g. schools, houses, jobs, infrastructure, welfare. • Providing resources e.g. food, water, land, energy. • Think about the possible consequences of a bad forecast………….for people, the environment.
Consider world population… • What factors determine world population change? • Birth rate. • Death rate. • Population will increase if birth rate is greater than death rate.
Study the graph.. http://www.fi.edu/guide/hughes/finiteresources.html
World Population growth • In 1500 the world’s population was 500m. • By 1800 it had slowly grown to 1 billion. • How long had it taken to double? • 300 years. • If you had been a population forecaster in 1800 when when would you have predicted that world population would reach 2 billion? • The Year 2100. • Yet world population was 6 billion by 2000, a six-fold increase.
What went wrong with the forecast? • Was the model incorrect? • No - birth rate and death rate were the only relevant variables. • Were previous trends a bad indicator of the future? • Yes - death rate dropped very rapidly over the last 150 years due to better healthcare, nutrition and living conditions.
What do the experts forecast? • World population is currently growing at 1.2% per annum , or 77 million people per year. • By 2050, world population is forecast to be between 7.9 billion (low variant) and 10.9 billion (high variant), and a medium variant of 9.3 billion. • Some experts forecast that world population could reach 12-15 billion or more before levelling off. • Why do these forecasts vary so much?
Regional growth rates differ… The graph shows population growth by continental region (1750-2050) • Asia is forecast to grow from 3.8bn to over 5bn. • What impact might this growth have on demand for resources such as fuel, wood and water? • Africa is also forecast to double in population by the year 2050. • What may change this forecast? • Higher death rate e.g. AIDS http://www.worldpopulationbalance.org/pop/stats.html
Asian giants • China and India currently comprise 30% of world population. • Which country is forecast to grow at the fastest rate up to 2050? • Both China and India are undergoing rapid development and industrialisation. • How might this affect their demand for fossil fuels and the impact on CO2 emissions?
Population growth rates change! http://www.ldeo.columbia.edu/edu/dees/V1003/lectures/population/
What else can we try to forecast? • Fuel consumption? • The rate of economic growth • CO2 emissions?
Fuel consumption? http://www.world-nuclear.org/education/whyu.htm
What are the variables? Too many to list but such thing as ….. Availability of fuel resources (and there are many?) Demand: which doesn’t just depend on the size of population size but also the level of economic development, geographical location and more.. Capital and technology Politics e.g. trade, international agreements More….. Fuel consumption is much more difficult to forecast!
This is the current picture of world fuel consumption http://www.fao.org/DOCREP/003/X8054E/x8054e26.gif Which are the major current fuel sources?
Primary energy consumption forecast 1860-2060 http://www.fao.org/DOCREP/003/X8054E/x8054e04.htm What is the overall predicted trend in energy consumption? Which group of countries is likely to increase consumption fastest?
World Energy production forecast 1970-2020 http://www.eia.doe.gov/emeu/cabs/archives/theamericas/theamericas.html What do forecasts suggest about energy production in a) America b) The rest of the World?
North v S America…. http://www.eia.doe.gov/emeu/cabs/archives/theamericas/theamericas.html Comment on forecasted energy consumption in the Americas.
World Energy consumption forecast by fuel type 1970-2025 http://www-sen.upc.es/Interno/Energia/world.html http://www.eia.doe.gov/oiaf/ieo/world.html Which fuels are forecast to continue to dominate world energy consumption until 2015? Why is this a concern? How could this situation be changed?
World CO2 emissions forecast by fuel type 1970-2025 http://www-sen.upc.es/Interno/Energia/world.html Describe the predictions for future C02 emissions
World CO2 emissions forecast by region 1970-2025 Which world regions are predicted to increase CO2 emissions a) most rapidly and b) least rapidly?
Energy use correlateswith level of economic development As countries develop they tend to consume more energy….
Energy related CO2 emissions per capita by region 1970-2025 What does this show about CO2 emissions per capita?
World Energy consumption by region 1970-2015 Which country group will continue to be the major energy consumer until 2015? How does this contrast with share of total population?
World Energy, GDP and Population trends 1970-2015 What does this graph suggest about the relationship between the rate of population growth and the rate of consumption of resources? How reliable do you think this forecast may be?
World Energy consumption in 3 economic scenarios 1970-2025 What does this graph show about the problem of predicting future energy consumption?
Which sources of energy do you think should be encouraged? Why?
What can be forecast with certainty? • Tides? • Solar and Lunar eclipses? • Transits of Venus?