Download
1 / 1
10 likes | 110 Views
Healthcare Consequences Associated With Non-Compliance in a Managed Care Population Ethel S. Siris, M.D. 1 , Ankita Modi, Ph.D. 2 , Jackson Tang, M.Sc. 3 , Shuvayu Sen, Ph.D. 2

E N D
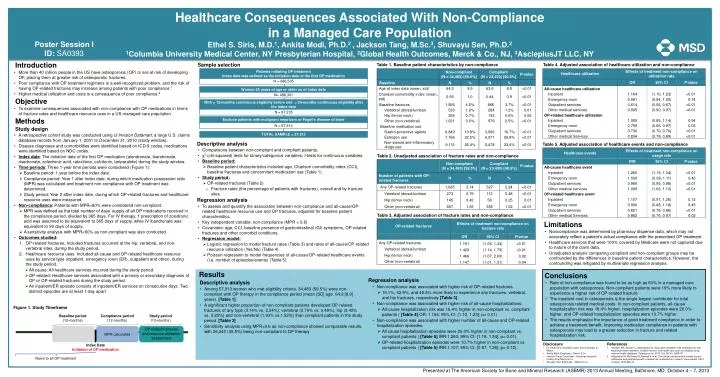
Healthcare Consequences Associated With Non-Compliance in a Managed Care Population Ethel S. Siris, M.D.1, Ankita Modi, Ph.D.2 , Jackson Tang, M.Sc.3, Shuvayu Sen, Ph.D.2 1Columbia University Medical Center, NY Presbyterian Hospital, 2Global Health Outcomes, Merck & Co., NJ, 3AsclepiusJT LLC, NY Poster Session I ID: SA0393 • Introduction • More than 40 million people in the US have osteoporosis (OP) or are at risk of developing OP, placing them at greater risk of osteoporotic fractures. • Poor compliance with OP treatment regimens is a well-recognized problem, and the risk of having OP-related fractures may increase among patients with poor compliance.1 • Higher medical utilization and costs is a consequence of poor compliance.2 • Objective • To examine consequences associated with non-compliance with OP medications in terms of fracture rates and healthcare resource uses in a US managed care population. • Methods • Study design • A retrospective cohort study was conducted using i3 Invision Datamart; a large U.S. claims database records from January 1, 2001 to December 31, 2010 (study window). • Disease diagnoses and comorbidities were identified based on ICD-9 codes, medications were identified based on NDC codes. • Index date: The initiation date of the first OP medication (alendronate, ibandronate, risedronate, zoledronic acid, raloxifene, calcitonin, teriparatide) during the study window. • Time periods: Three 1-year time periods were considered (Figure 1): • Baseline period: 1 year before the index date. • Compliance period: Year 1 after index date, during which medication possession ratio (MPR) was calculated and treatment non-compliance with OP treatment was determined. • Study period: Year 2 after index date, during which OP-related fractures and healthcare resource uses were measured. • Non-compliance: Patients with MPR<80% were considered non-compliant. • MPR was defined as the total number of days’ supply of all OP medications received in the compliance period, divided by 365 days. For IV therapy, 1 prescription of zoledronic acid was assumed to be equivalent to 365 days of supply, while IV ibandronate was equivalent to 90 days of supply. • A sensitivity analysis with MPR<60% as non-compliant was also conducted. • Outcomes studied: • OP-related fractures. Included fractures occurred at the hip, vertebral, and non-vertebral sites, during the study period. • Healthcare resource uses. Included all-cause and OP-related healthcare resource uses by service type (inpatient, emergency room (ER), outpatient and other), during the study period. • All-cause: All healthcare services incurred during the study period. • OP-related: Healthcare services associated with a primary or secondary diagnosis of OP or OP-related fractures during the study period. • An inpatient/ER episode consists of inpatient/ER services on consecutive days. Two distinct episodes are at least 1-day apart. • Sample selection Table 4. Adjusted association of healthcare utilization and non-compliance Table 1. Baseline patient characteristics by non-compliance • Descriptive analysis • Comparisons between non-compliant and compliant patients. • χ2(chi-squared)tests for binary/categorical variables, t-tests for continuous variables. • Baseline period: • Baseline patient characteristics included age, Charlson comorbidity index (CCI), baseline fractures and concomitant medication use (Table 1). • Study period: • OP-related fractures (Table 2) • Fracture rates (the percentage of patients with fractures), overall and by fracture sites. • Regression analysis • To assess and quantify the association between non-compliance and all-cause/OP-related healthcare resource use and OP fractures, adjusted for baseline patient characteristics. • Key independent variable: non-compliance (MPR < 0.8) • Covariates: age, CCI, baseline presence of gastrointestinal (GI) symptoms, OP-related fractures and other comorbid conditions. • Regression model: • Logistic regression to model fracture rates (Table 3) and rates of all-cause/OP-related resource utilization (Yes/No) (Table 4). • Poisson regression to model frequencies of all-cause/OP-related healthcare events (i.e. number of episodes/events) (Table 5). Table 5. Adjusted association of healthcare events and non-compliance Table 2. Unadjusted association of fracture rates and non-compliance Table 3. Adjusted association of fracture rates and non-compliance Patients initiating OP treatment Index date was defined as the initiation date of the first OP medication • Limitations • Noncompliance was determined by pharmacy dispense data, which may not accurately reflect a patient’s actual compliance with the prescribed OP treatment. • Healthcare services that were 100% covered by Medicare were not captured due to nature of the claim data. • Unadjusted analysis comparing compliant and non-compliant groups may be confounded by the differences in baseline patient characteristics. However, the confounding was mitigated by multivariate regression analysis. N = 686,505 Women 55 years of age or older as of index date N= 488,361 • Conclusions • Rate of non-compliance was found to be as high as 60% in a managed care population with osteoporosis. Non-compliant patients were 19% more likely to experience a higher risk of OP-related fracture • The inpatient cost in osteoporosis is the single largest contributor for total osteoporosis related medical costs. In non-compliant patients, all-cause hospitalization risk was 16.4% higher, hospitalization episodes were 26.0% higher, and OP-related hospitalization episodes were 10.7% higher. • The results emphasize the importance of good treatment compliance in order to achieve a treatment benefit. Improving medication compliance in patients with osteoporosis may lead to a greater reduction in fracture and related hospitalization risk. • Results • Descriptive analysis • Among 57,913 women who met eligibility criteria, 34,483 (59.5%) were non-compliant with OP therapy in the compliance period (mean [SD] age, 64.2 [8.9] years). [Table 1] • A significant higher proportion of non-compliant patients developed OP-related fractures of any type (3.14% vs. 2.24%); vertebral (0.79% vs. 0.48%), hip (0.42% vs. 0.25%) and non-vertebral (1.93% vs.1.52%) than compliant patients in the study period. [Table 3] • Sensitivity analysis using MPR<0.6 as non-compliance showed comparable results, with 26,340 (45.5%) being non-compliant to OP therapy • Regression analysis • Non-compliance was associated with higher risk of OP-related fractures. • 19.1%, 42.9%, and 46.6% more likely to experience any fractures, vertebral, and hip fractures, respectively [Table 3]. • Non-compliance was associated with higher risk of all-cause hospitalizations. • All-cause hospitalization risk was 16.4% higher in non-compliant vs. compliant patients ( [Table 4] OR: 1.164; 95% CI: [1.10, 1.23]; p< 0.01) • Non-compliance was associated with higher number of all-cause and OP-related hospitalization episodes. • All cause hospitalization episodes were 26.0% higher in non-compliant vs. compliant patients ( [Table 5] IRR:1.260; 95% CI: [1.19, 1.34]; p< 0.01). • OP-related hospitalization episodes were 10.7% higher in non-compliant vs. compliant patients ( [Table 5] IRR:1.107; 95% CI: [0.97, 1.26]; p= 0.12). With>12-months continuous eligibility before and >24-months continuous eligibility after the index date N = 87,235 Exclude patients with malignant neoplasm or Paget’s disease of bone Figure 1. Study Timeframe N = 57,913 • Disclosure • Dr. Ethel Siris: Scientific expert and consultant to Merck. • Ankita Modi: Employee – Merck & Co. • Jackson Tang: Consultant – Received research funding from Merck & Co. • Shuvayu Sen: Employee – Merck & Co. References AnOlsen KR, Hansen C, Abrahamsen B. Association between refill compliance to oral bisphosphonate treatment, incident fracture, and health care costs-an analysis using national health database. Osteoporos Int. 2013 Oct; 24(10): 2639-47 Hiligsmann M, McGowan B, Bennett K et al. The clinical and economic burden of poor adherence and persistence with osteoporosis medications in Ireland. Value Health. 2012 Jul-Aug; 15(5):604-12 Naive to all OP treatment Presented at The American Society for Bone and Mineral Research (ASBMR) 2013 Annual Meeting, Baltimore, MD, October 4 – 7, 2013 TOTAL SAMPLE = 57,913 Baseline period (12-months) Compliance period (12-months) Study period (12-months) MPRcalculated OP-related fractures and resource utilization assessment Index Date Initiation of OP medication