Download
1 / 18
180 likes | 276 Views
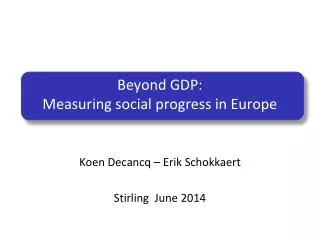
Measuring social progress in communities. Today. About Social Life Measuring wellbeing at the local level WP9 Pan-European stocktake Case studies Key findings What next ?. About Social Life. The Young Foundation. Social Life. Measuring wellbeing at a local level.

E N D
Today • About Social Life • Measuring wellbeing at the local level • WP9 • Pan-European stocktake • Case studies • Key findings • What next?
About Social Life The Young Foundation Social Life
WP9: Work package stages Stage one Young Foundation Inventory of pan-European indicators Stage two Young Foundation Case Studies in Barcelona & Malmö Stage three UNISI & UNIPI Convene expert workshop Stage four Young Foundation Report & recommendations
Pan-European stocktake National level Pan-European country level data Regional level (NUTS 1-5) European sub-country level units Data for: England, Ireland, France, Spain, Sweden
Methodological challenges: • NUTS are problematic at local level • Multiple geographical units • Timeliness • Cultural differences • Robustness & sample size • Data availability and co-ordination between agencies places limitations on what can be done.
Case studies • What does resilience and wellbeing mean in other neighbourhoods in Europe? Local Level data Inventory of pan-European indicators Les Roquetes (Barcelona) & Lindängen (Malmö)
Key findings from case studies The data wasn’t capturing the strengths and needs in both these areas. For example: • Sense of belonging to the local area • Volunteering • Ability to influence local decisions • Social capital • Financial security This makes it difficult for local agencies to act accordingly
Overall findings • Country level data maps to WARM framework • The larger the spatial unit, the more data there is available • More data at individual level (eg. education, health, employment) rather than collective level (eg. neighbourliness, sense of belonging to local area) • Local level wellbeing and resilience is often invisible in data Therefore… • Need to bridge top-down and bottom-up data collection • Local agencies need to collectively find ways to capture this data • Need to think of a role for crowd-sourced locally generated data
WARM version 2, using predictive data from national surveys What next? Resilience Wellbeing
A framework for social sustainability Social Life Social Sustainability Framework, 2011
lucia.caistor@social-life.co nicola.bacon@social-life.co www.social-life.co @SL_Cities