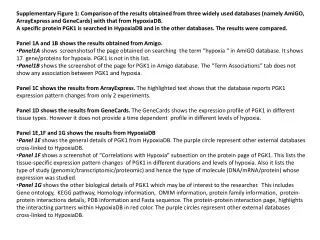
Download
1 / 4
40 likes | 141 Views
Supplementary Figure 1A. Patients with HCC. Patients with No HCC. Model building n = 255. 14.5 %. Yes. No. HBV. n = 35. n = 220. 10.0 %. 42. %. Male. Female. Group 1. Sex. n = 100. n = 120. 3.0 %. 15.8%. Yes. No. Group 2. Exogenous insulin. n = 13. n = 107.

E N D
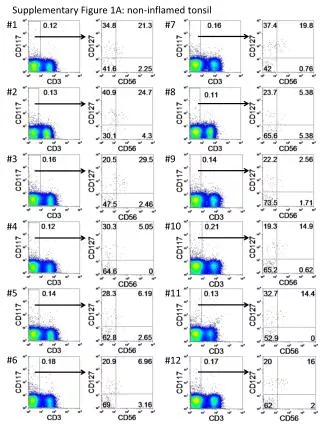
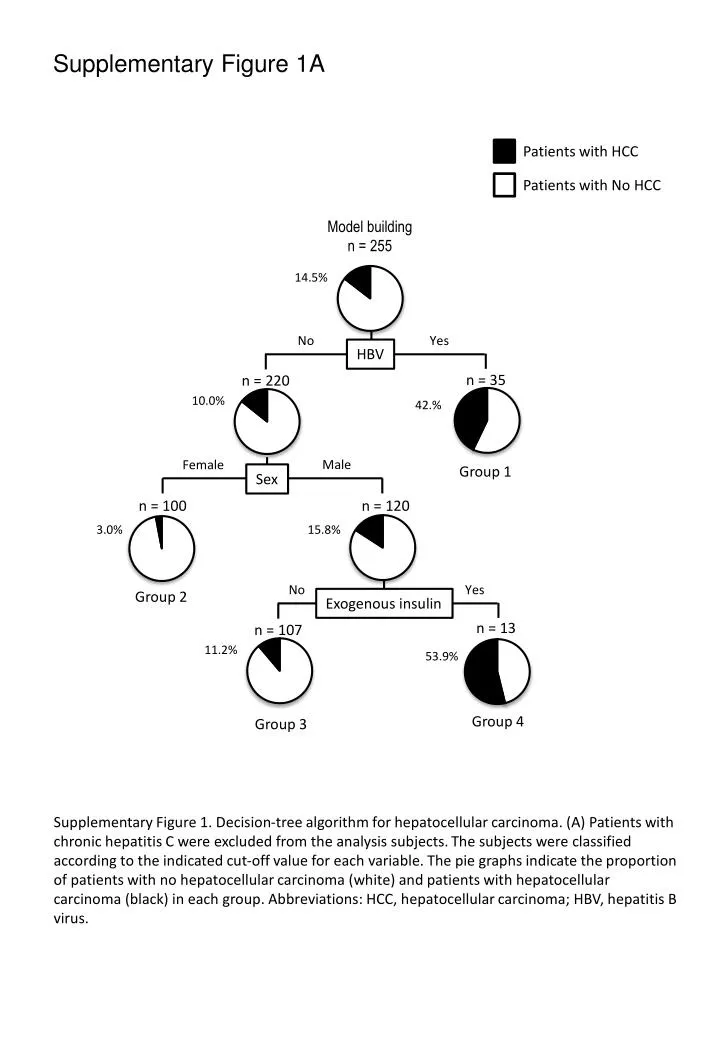
Supplementary Figure 1A Patients with HCC Patients with No HCC Model building n = 255 14.5% Yes No HBV n = 35 n = 220 10.0% 42.% Male Female Group 1 Sex n = 100 n = 120 3.0% 15.8% Yes No Group 2 Exogenous insulin n = 13 n = 107 11.2% 53.9% Group 4 Group 3 Supplementary Figure 1. Decision-tree algorithm for hepatocellular carcinoma. (A) Patients with chronic hepatitis C were excluded from the analysis subjects. The subjects were classified according to the indicated cut-off value for each variable. The pie graphs indicate the proportion of patients with no hepatocellular carcinoma (white) and patients with hepatocellular carcinoma (black) in each group. Abbreviations: HCC, hepatocellular carcinoma; HBV, hepatitis B virus.
Supplementary Figure 1B Patients with HCC Patients with No HCC Model building n = 220 10.0% Male Female Sex n = 100 n = 120 3.0% 15.8% Yes No Group 1 Exogenous insulin n = 13 n = 107 11.2% 53.9% Group 3 Group 2 Supplementary Figure 1. Decision-tree algorithm for hepatocellular carcinoma. (B) Patients with chronic hepatitis B and chronic hepatitis C were excluded from the analysis subjects. The subjects were classified according to the indicated cut-off value for each variable. The pie graphs indicate the proportion of patients with no hepatocellular carcinoma (white) and patients with hepatocellular carcinoma (black) in each group. Abbreviations: HCC, hepatocellular carcinoma.
Supplementary Figure 2A Patients with extra-hepatic cancer Patients with no extra-hepatic cancer Model building n = 255 12.9% < 81 years old ≥ 81 years old Age n = 239 n = 16 10.5% 50.0% Yes No Group 1 Sulfonylurea n = 206 n = 33 8.8% 21.2% Group 3 Group 2 Supplementary Figure 2. Decision-tree algorithm for extra-hepatic cancer. (A) Patients with chronic hepatitis C were excluded from the analysis subjects. The subjects were classified according to the indicated cut-off value for each variable. The pie graphs indicate the proportion of patients with no hepatocellular carcinoma (white) and patients with hepatocellular carcinoma (black) in each group.
Supplementary Figure 2B Patients with extra-hepatic cancer Patients with no extra-hepatic cancer Model building n = 220 13.6% < 81 years old ≥ 81 years old Age n = 204 n = 16 10.8% 50.0% Yes No Group 1 Sulfonylurea n = 174 n = 30 9.2% 20.0% Group 3 Group 2 Supplementary Figure 2. Decision-tree algorithm for extra-hepatic cancer. (B) Patients with chronic hepatitis B and chronic hepatitis C were excluded from the analysis subjects. The subjects were classified according to the indicated cut-off value for each variable. The pie graphs indicate the proportion of patients with no hepatocellular carcinoma (white) and patients with hepatocellular carcinoma (black) in each group.