Download
1 / 40
400 likes | 489 Views
Molecular component in the Milky Way. SAAS-FEE Lecture 2 Françoise COMBES. CO surveys of the Milky Way. CfA-Harvard Survey, 1.2m diameter, beam 9', sampling 0.12°, North and South (Dame et al 87, 2001), sky coverage ~0.5 until |b| < 32° Bell Labs 7m, beam 1.7' (Stark et al 88, 89)

E N D
Molecular component in the Milky Way SAAS-FEE Lecture 2 Françoise COMBES
CO surveys of the Milky Way • CfA-Harvard Survey, 1.2m diameter, beam 9', sampling 0.12°, North and South (Dame et al 87, 2001), sky coverage ~0.5 until |b| < 32° • Bell Labs 7m, beam 1.7' (Stark et al 88, 89) • NRAO-Kitt Peak, 12m, beam 60", sky covered 10-3 • Mass-SB, 14m, beam 45", sky covered 10-2 (Solomon, Scoville, Sanders et al) FCRAO • CO(2-1) Sakamoto (1995) R21/10 = 0.66 • 13CO Bell Labs , Bordeaux, Columbia..
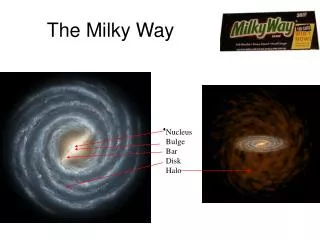
Comparison with an optical image, of the CO clouds within 2.5kpc distance (within 10 to 35km/s) Dame et al (2001)
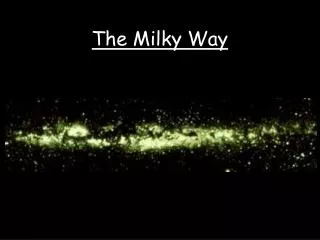
Comparison with HI and 100μ IRAS maps CO smoothed to 36' ICO>1Kkm/s blanked
Comparison of ICO with a prediction from the FIR and HI emission Take the ratio Ngas/IRAS when gas =HI only, then from IRAS derive gas map, subtract the observed HI => H2 ΔWCO/WCO =50% average up to > 100%
The predicted H2 map can be used to estimate the CO-H2 conversion ratio As a function of b The drop with z is 6 times steeper than for a plane // layer Dame et al (2001)
CO Distribution and Spiral structure of the Milky Way How to obtain distances ? Kinematic models Determination of the rotation curve, from terminal velocities Assumption of circular velocity for the gas Ambiguities of distance, for material at longitudes below 90deg To remove the degeneracy: the latitude or height above the plane can play a role statistically Also the distance of the near stars, determined by their spectrum or by absorption (in front or behind)
Locus Ambiguity of distances V_rad (r,l) = Rsun sinl (Ω(R)-Ωsun)
Radial Distribution > Large concentration in the center > Hole around 2kpc > Galactic Molecular ring between 4 and 8 kpc > Exponential radial decrease in average
Radial distribution of CO in the MW, from Bronfman et al 1988 Uncertainties in correcting for the 3kpc arm, calibrations, etc..
Spiral Structure • Evidence of a spiral structure, through the l-V diagram • Very difficult to deproject • Barred structure (through the orbits, parallelogram..) • Best is to build N-body models (cf Mulder & Liem 86, Fux 99) • Second (nuclear) bar? (visible with 2MASS, Alard 2001)
Observed l-V diagram Original Retrieved
The inner Galaxy Always a big puzzle: forbidden velocities in the center Expansion (Oort 77)? Explosion from the center? (Sanders 76) Bar potential (Peters 1975) Bar directly seen in COBE-DIRBE (Dwek et al 95) Interpretation in terms of periodic orbits in a bar potential parallel x1 orbits, perpendicular x2 orbits (Binney et al 97) Characteristic parallelogram Nuclear disk decoupled from the main disk
Expanding molecular ring EMR -0.6° < b < 0.6° 13CO Bally et al (1988) Clump 2 Clump 1 3kpc arm parallelogram -0.1° < b < 0.1° 12CO Bally et al 87
From Fux (1999) N-body simulations+SPH Bar taken from DIRBE The center of the bar wanders Gas flow asymmetric non-stationary Transient 3kpc arm is a spiral round the bar Parallelogram interpreted as leading dust-lanes
Bania's clump and V-elongated features near l=55° are gas lumps crossing the dust-lane shocks Inclination of the bar 25° Corotation radius 4.5 kpc b/a = 0.6 Other features: inclined plane in the center strong m=1
Fux (1999) Velocities above the circular model The region around 3kpc arm is subject to strong non-circular motions Strong asymmetries
Interpretation of the central l-V diagram from Fux (1999) x2 orbits are almost circular x1 cusped orbits produce the parallelogram
Nature of molecular clouds in the inner galaxy • Distinct physical parameters from those of the disk • Denser, by 2 orders of magnitude (> 104 cm-3) • revealed by high density tracers, HCN, CS • Tidal forces larger: differentiating V2/R, if V~cst • V2/R2 (d/2) ~ 4 GMc/d2, gives the minimum density of clouds • ρc =3/(4πG) V2/R2 = 103 cm-3 (200pc/R)2 • Below this, clouds are sheared off to the diffuse medium • High velocity dispersion in the center, due to the Toomre criterion
Vertical Distribution • Comparison of the molecular and atomic thicknesses • Difficult to obtain, although the (l,b) map is much thinner than HI • Projection effects local gas, and warped outer gas for the HI • Obtained in the Milky Way, at the tangent points • (Malhotra et al 1994, 95) • Obtained in external galaxies in face-on objects, • or edge-on systems • Thickness hg and vertical velocity dispersion σg
Vertical equilibrium Isothermal disk model, self-gravitating hg(r) = 2(r) /(2g(r)) The density profile is then a sech2 law If the gas is considered as test particles in a potential of larger scale height Kz z The density has then a gaussian profile g = 0 exp(-Kzz2/(2g2)) with a characteristic height hg(r) = (r) /(Kz)1/2 with Kz= 4Gt
Observed in the HI gas, the velocity dispersion is constant with radius, and equal to 10km/s (12km/s in the center) This is best seen in face-on galaxies In the molecular component, also g = cste Face-on galaxies (NGC 628, NGC 3938..) The surprising observation is that both dispersion (atomic and molecular) are about equal (Combes & Becquaert 1997) Not compatible with so different thicknesses? (60 and 220 pc)
NGC 628 face-on CO(1-0) dispersion Soustraction of the expected linewidth due to the systematic gradient (rotation) Combes & Becquaert 97
In the Milky Way, modelisation of hg and g at the tangential points (Malhotra 1994) azimuthal velocity dispersion Gives almost no variation with radius (except the galactic center) => an idea of the heating processes? Large uncertainty in the literature, from 4 to 11 km/s clumpiness of molecular clouds Scale-height of the gas expected to be higher than that of the cloud centers In average, in the MW, dispersion of 8km/s (averages over 200-400pc), scale-height of 75pc Scale-height slightly increasing with radius The shape of the density law: not gaussian, but tails of small clouds
High latitude clouds (Magnani, Blitz, Mundy 1985) The centroid of the plane departs from z=0 more than the scale height Phase transition HI --> H2 If the velocity dispersions of atomic and molecular gas are close, this is explained by the phase transition of the gas, that follows its dynamics. CO is observed more in the plane than the more diffuse HI, but the dispersion is about the same (Imamura & Sofue 1997) Sudden transition, depending on P, UV radiation, density
The HI thickness 200pc is not explained through the tubulent velocity (g = 9km/s) The HI needs extra support to keep its height (Malhotra 1995) The deduced mid-plane mass density is exponential (constant mass-to-light ratio)
Origin of the heating? Star formation in the center of the optical disk Gravitational instabilities in quiet areas Toomre criterion for stability self-regulating Flaring of the plane: thickness increasing linearly with radius visible in HI, and also in the molecular plane The total density in the plane is decreasing Less restoring force, same velocity dispersion ==> increased thickness
Flaring of the HI plane almost linear hg = h0 + 0.045 * R Merrifield (1992) The CO/H2 follows the flare, and also the warp Grabelsky et al (1987)
Warping of the plane Spectacular in HI Asymmetrical (only one side) Corrugations (larger amplitude than hg) The CO follows the warp Also observed in external galaxies, in particular M31 CO observed with 2 velocities, at each crossing of the warped plane
Models of PV diagrams for M31 Warped thin plane from Henderson (79) Characteristic figure-8 shape (see also Brinks & Burton 84)
High Velocity Clouds HI mainly, no CO detected until now consistent with their belonging to the Magellanic Stream of low metallicity H2 detected through UV absorption lines (Richter et al 2001, Tumlinson et al 2002) Very low metallicity gas 0.09 solar (Wakker et al 1999) Infall of gas at Z=0.1 solar required 1Mo/yr to solve the G-dwarf problem External galaxies: dwarf companions, Lyα forest, ...
Gamma-ray surveys In the Milky Way, the detection of gamma-rays of high energy (> 100Mev) is a tracer of all matter Nucleons (HI, H2, HII..) interact with cosmic rays to produce pions, that disintegrate in gamma-rays Early surveys showed that the CO/H2 conversion ratio must not be constant throughout the Galaxy (Wolfendale et al 1977)
Bloemen (1989) Strong et al (1988) Gamma-rays extend radially much more than the expected extent from their sources (the CR, Supernovae), and the gas extent Diffusion of CR? Today, the lack of gamma-rays in the center is confirmed by EGRET on GRO Excess towards high latitude, above the plane Interpretation in terms of nucleons? (de Paolis et al 1999) or inverse-Compton, etc.. (Strong & Mattox 1996, Strong et al 1999)
Dixon et al 98 Galactic diffuse emission model Halo of MW: residual
Gamma-ray profile at high latitudes, for E = 70-100 Mev horizontal line= isotropic background Gamma-ray spectrum for the inner galaxy, Models for "conventional" CR spectra
Gamma-ray spectrum of inner Galaxy Models for a hard electron injection spectrum Data from OSSE, COMPTEL, EGRET Same for high latitudes
Conclusion • About comparable amounts of H2 and HI gas in the MW • M(H2) ~ 2-3 109 Mo • Very different radial repartition • H2 is centrally concentrated, then in a molecular ring 4-8kpc • HI depleted in the center • and much more radially extended • Repartition in clouds, GMC of 106Mo -- clumpiness • Thinner plane than HI, about the same σg • same flare and warping