Download
1 / 60
600 likes | 709 Views
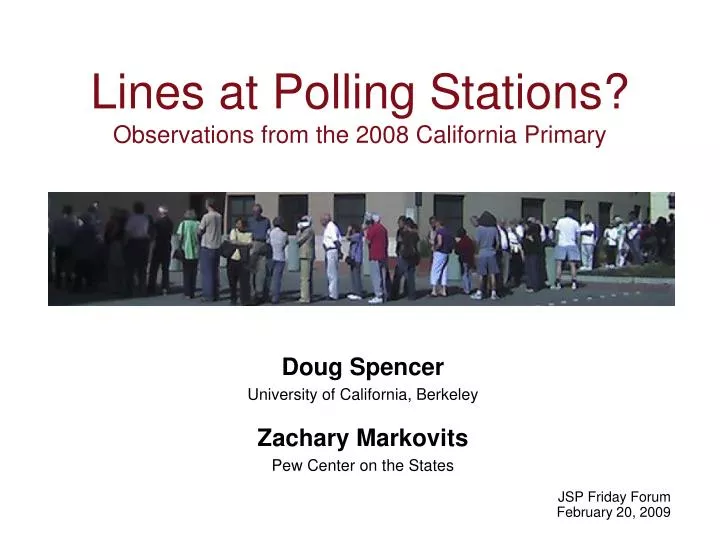
Lines at Polling Stations? Observations from the 2008 California Primary. Doug Spencer University of California, Berkeley Zachary Markovits Pew Center on the States JSP Friday Forum February 20, 2009. Lines long as 1-stop voting ends From staff reports

E N D
Lines at Polling Stations?Observations from the 2008 California Primary Doug Spencer University of California, Berkeley Zachary Markovits Pew Center on the States JSP Friday Forum February 20, 2009
Lines long as 1-stop voting ends From staff reports The final day of one-stop voting before Tuesday’s primary brought long lines to polling stations today. “We’ve got lines everywhere,” said Cherie Poucher, director of the Wake County Board of Elections. “I think they’re wrapped around every building. And we’re processing them as quick as we can.” Election 2004 Biggest voting gripe: long lines Other than that, the election went fairly smoothly, officials say, with just a few glitches here and there. By DAVID KARP, TOM ZUCCO, STEPHEN NOHLGREN, LEONORA LaPETER Published November 3, 2004 November 7, 2004 Voting Problems in Ohio Set Off an Alarm By ADAM LIPTAK Voters in Ohio delivered a second term to President Bush by a decisive margin. But the way the vote was conducted there, election law specialists say, exposed a number of weak spots in the nation's election system. There were also long lines at the polls, and it is unclear how many people grew too dispirited to keep waiting and ended up not voting. Long lines, mischief, make for slow voting Widespread glitches in electronic equipment caused delays Douglas weighs vote fix 3 Options listed. The county, placed on a watch list by the state, is determined to reduce wait times and tech glitches. Democratic and majority black, the 38-year-old mortgage broker found a line snaking out f the precinct door. She stood in line for four hours -- one hour in the rain -- and watched dozens of potential voters By Michael Powell and Peter Slevin Wednesday, December 15, 2004 COLUMBUS, Ohio -- Tan Thivener's is a tale of two voting precincts in Franklin County. In her city neighborhood, which is vastly Early voting ends with long lines By Nancy H. McLaughlin Staff Writer Sunday, May. 4, 2008 3:00 am GREENSBORO — Early voting in Guilford County ended Saturday with citizens waiting for hours just to cast their ballots. "We were expecting a large turnout," said Tim Tsujii, the county's Early Voting coordinator, "but we got a tremendous turnout." Saturday was the last day unregistered voters could register for Tuesday's primary — but they had to cast their votes the same day. Several Factors Contributed to 'Lost' Voters in Ohio Long lines receive a lot of attention in the media EXAMPLES OF NEWS STORIES Long lines on Election Day enhance appeal of early voting By Jim Drinkard, USA TODAY
Lines may be disproportionately correlated to race ARE ELECTION DAY LINES THE NEW POLL TAX?
There have been a number of major races decided by 1% or less since 2000 CLOSE ELECTIONS IN THE U.S.
Estimates of lost votes are based on theoretic models and self-reported surveys LITERATURE • 20,000 did not vote in Franklin County, OH in 2004 • Highton (2006) • Allen & Bernshteyn (2006) • 500,000 – 1.2 million lost votes in 2004 due to poor polling station operations • Caltech/MIT Voting Tech Project (2006) • 2.6 million lost votes due to long lines in 2008 • Cooperative Congressional Election Study (2009, forthcoming)
Most scholars treat polling stations as a black box Voter registration Polling Stations Election results
#@&! Lines form in response to unbalanced arrivals and service times POLLING STATION SCHEMATIC
Our research aims to capture data related to the variables that cause lines RESEARCH QUESTIONS • How are arrivals distributed throughout the day? • What factors affect the time it takes a voter to check-in? • What factors affect the time it takes voters to cast a ballot?
#@&! There are two voting services POLLING STATION SCHEMATIC Service 1 Service 2
The first service is provided at the check-in table SERVICES PROVIDED AT THE CHECK-IN TABLE • Your identity is verified • Get your ballot • Instructions on how to use voting machine • Answers to general questions
These services are provided by poll workers POLL WORKER PROBLEMS • Recruiting • Attrition (40% in CA) • Compensation (~$100/day) • Training (1 to 3 hours) • Low Confidence
#@&! The second service is provided by a voting system POLLING STATION SCHEMATIC Service 1 Service 2
Any voting system has 3 components COMPONENTS OF A VOTING SYSTEM Cast Verified Tabulated
Lever Machine Punchcard Datavote There are several different kinds of voting systemsSome old: MANUAL VOTING TECHNOLOGIES
There are several different kinds of voting systemsSome new: ELECTRONIC VOTING SYSTEMS Optical scanners Direct recording electronic (DRE)
HAVA % of counties The use of electronic voting machines has become the norm USE OF VOTING TECHNOLOGY IN THE U.S. Source: Election Data Services, Inc. 2006 Voting Equipment Study
Voting Technology is not uniformly implemented within states NOVEMBER 2006 VOTING EQUIPMENT USAGE BY COUNTY
Choosing polling stations to observe • SAMPLE • 3 counties • 10 polling stations per county • Geographically clustered • Stratified by income
#@&! In general, all polling stations operate in a similar way POLLING STATION SCHEMATIC
Check-in Voting Machine #@&! Finish Voting and Exit In San Mateo County, voters used DRE machines POLLING STATION SCHEMATIC
Check-in Booth #@&! Drop ballot in box Exit In Napa County, voters filled out paper ballots POLLING STATION SCHEMATIC
Check-in Booth #@&! Scanner In Alameda County, voters used paper ballots that were scanned POLLING STATION SCHEMATIC Get new ballot Misvote Exit Okay
Questionnaire #@&! We gathered data related to 3 variables: arrival, check-in, and voting POLLING STATION SCHEMATIC Arrival Rate Service Time 1 Service Time 2
#@&! Our model called for 2 data gatherers per polling station POINTS OF OBSERVATION Voter Observer Attendance Counter
#@&! The attendance counter tallied arrivals in 10 minute intervals ROLE OF THE ATTENDANCE COUNTER Attendance Counter
#@&! The attendance counter tallied arrivals in 10 minute intervals ROLE OF THE ATTENDANCE COUNTER Attendance Counter
Voter Observer The voter observer tracked every 5th voter ROLE OF THE VOTER OBSERVER Note the time every 5th voter: Begins the check-in process Leaves the check-in table Enters the voting booth Leaves the voting booth Scans ballot (Alameda only)
Voter observers used digital clocks to fill in data sheets SAMPLE DATA SHEET
Voter observers used digital clocks to fill in data sheets SAMPLE DATA SHEET
Our dataset is better than we anticipated OVERVIEW OF DATA • 11,858 arrivals tallied • 2,160 individual voters tracked • 153 poll worker questionnaires administered • 30% more turnout than we predicted
25% of all voters Arrivals were not evenly distributed throughout the day ARRIVAL RATE BY COUNTY (IN MINUTES)
Lines were longest between 5:00 and 7:00 p.m. # OF PEOPLE STANDING IN LINE BY COUNTY
Arrival rate and line length are highly correlated ARRIVAL RATE AND # OF PEOPLE IN LINE
There were three distinct peaks in reneging rates # OF PEOPLE WHO RENEGED
Both check-in and voting varied between counties MEAN SERVICE TIMES BY COUNTY DRE Op Scan - Central Op Scan - Precinct
Both check-in and voting varied between counties MEAN SERVICE TIMES BY COUNTY DRE Op Scan - Central Op Scan - Precinct
Our model takes into account several characteristics MODEL OF FACTORS AFFECTING CHECK-IN TIME Check-inTimevpjt= + 1Xp+ 2Wpt + 3Yvpjt + 4Zv + vpjt Xp= County Yvpjt =Age of poll worker Population Density Years of experience Wpt = # of poll workers Zv =Male or Female Arrival rate Used equipment for disabled
Several of our a priori hypotheses were confirmed COEFFICIENTS OF INTEREST (in min) + 42 sec Disabled = .696* (.312) Absentee = -.890** (.245) Provisional = 1.73** (.169) PaperballotSM = .583** (.283) Alameda =.796** (.253) San Mateo=.605** (.229) Medhhinc =-.162** (.019) + 48 sec - 53 sec + 36 sec + 1 min 44 sec - 10 sec + 35 sec Cons. 1.22** (.289) R2 (adj.) .1492 N 1,589 *p.05, **p.01 Standard error shown in parenthesis
Two of our results surprised us COEFFICIENTS OF INTEREST ? Number of Poll Workers at the Check-in table NumberPW=.091** (.033) Poll Worker had experience PWexperienced=.466** (.163) + 6 sec + 28 sec Cons. 1.22** (.289) R2 (adj.) .1492 N 1,589 *p.05, **p.01 Standard error shown in parenthesis
These findings are not as counterintuitive as we first thought POSSIBLE EXPLANATIONS FOR LONGER CHECK-IN TIMES Additional Poll Workers at the Check-in table increases check-in time • System Design Problem • Overall Management Problem Experienced poll workers take longer to check in voters • Confused about which rules apply • More relaxed with rules - “Chatty Cathy”
Both check-in and voting varied between counties MEAN SERVICE TIMES BY COUNTY DRE Op Scan - Central Op Scan - Precinct
Both check-in and voting varied between counties MEAN SERVICE TIMES BY COUNTY DRE Op Scan - Central Op Scan - Precinct
Ballot completion rate does not explain this variance DIFFERENCE BETWEEN % OF BALLOTS CAST Source: Alameda and San Mateo registrar of voters website, 2008
Ballot completion rate does not explain this variance DIFFERENCE BETWEEN % OF BALLOTS CAST Source: Alameda and San Mateo registrar of voters website, 2008
Ballot completion rate does not explain this variance DIFFERENCE BETWEEN % OF BALLOTS CAST Source: Alameda and San Mateo registrar of voters website, 2008
Our model of voting time considered several variables MODEL OF FACTORS AFFECTING VOTING TIME VotingTimevpt= + 1Xp+ 2Wpt + 3Zv + vpt Xp= County Zv =Male or Female Population density Used disabled machine % precinct non-white Wpt = Ballot length Number of poll workers Main coefficient of interest: county