Download
1 / 18
190 likes | 336 Views
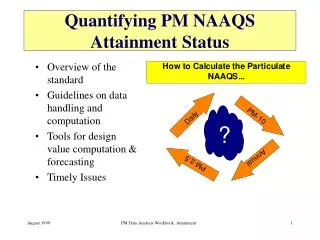
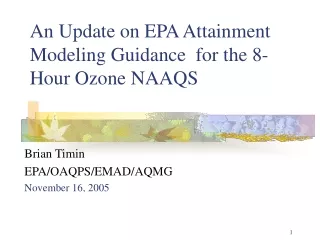
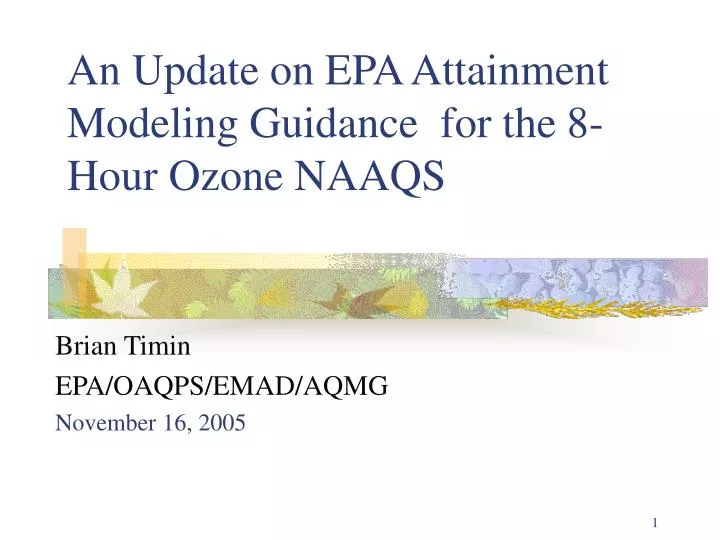
An Update on EPA Attainment Modeling Guidance for the 8-Hour Ozone NAAQS. Brian Timin EPA/OAQPS/EMAD/AQMG November 16, 2005. Status of Ozone Modeling Guidance. “Guidance on the Use of Models and Other Analyses in Attainment Demonstrations for the 8-hour Ozone NAAQS”

E N D
An Update on EPA Attainment Modeling Guidance for the 8-Hour Ozone NAAQS Brian Timin EPA/OAQPS/EMAD/AQMG November 16, 2005
Status of Ozone Modeling Guidance • “Guidance on the Use of Models and Other Analyses in Attainment Demonstrations for the 8-hour Ozone NAAQS” • Original draft released in 1999 • Released “Draft Final” version on February 17th, 2005 • Comments received in March • Final version released November, 2005 • Available on EPA’s website at: • http://www.epa.gov/scram001/guidance_sip.htm
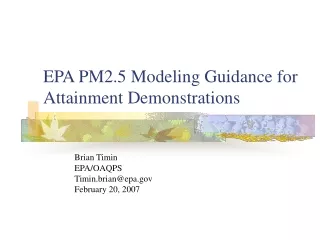
Status of PM2.5/Regional Haze Modeling Guidance • “Guidance for Demonstrating Attainment of Air Quality Goals for PM2.5 and Regional Haze” • January, 2001 • Available on EPA’s website at: http://www.epa.gov/scram001/guidance/guide/draft_pm.pdf • Revised draft will be available by the end of 2005 • Final version in early 2006 • Plan to incorporate final version of ozone and PM2.5 guidance into a single document
Final Ozone Modeling Guidance- Key Updates • Screening test/unmonitored areas • Where is the attainment test applied? • Calculation of current/baseline design values • Language concerning transport • Which future year to model? • Weight of evidence/supplemental analyses • Minimum RRF threshold • Minimum number of days to model
Attainment Test in Unmonitored Areas • We eliminated the “screening test” and replaced it with an “unmonitored area analysis”. • Use “model adjusted” spatial fields to estimate ozone concentrations in unmonitored areas. • The spatial fields can be created using software provided by EPA. We have a work assignment in place to create the software and plan to perform an example analysis
Attainment Test in Unmonitored Areas • Policy issue: “While it is expected that additional emissions controls are needed to eliminate predicted violations of the monitor based test, the same requirements may not be appropriate in unmonitored areas...... Due to the uncertainty of the analysis, at a minimum, it is appropriate to commit to additional deployment of ozone monitors in areas where the unmonitored area analysis predicts future violations...... Violations of the unmonitored area analysis should be handled on a case by case basis. As such, additional analyses and/or tracking requirements may be needed depending on the nature of the problem and the uncertainty associated with the potential violation.”
Where is the Attainment Test Applied? • The issue is specifically addressed within the unmonitored area analysis. • It is assumed that the monitored attainment test will be applied within the nonattainment area. • Language concerning areas outside of the NAA:“…The unmonitored area analysis for a particular nonattainment area is intended to address potential problems within or near that nonattainment area. The analysis should include, at a minimum, all nonattainment counties and counties surrounding the nonattainment area (located within the State)…. In large States, it is possible that unmonitored area violations may appear in counties far upwind or downwind of the local area of interest. In those cases, the distance to the nonattainment area and ability of the modeling to represent far downwind areas should be evaluated on a case by case basis.””
Calculation of Current/Baseline Design Values • Continue to use the 5 year “weighted” average design values as the basis for future year projections. • The 3 design value periods which straddle the base emissions year are averaged (at each monitor) • Supporting analysis of 10 years of DV data shows that the weighted DV is much more stable than a single DV • The calculation is consistent with CAIR
Treatment of Transport and Downwind Impacts • Transport within the context of section 110 (a)(2)(d) and 126 are not mentioned. • Assumed that the NOx SIP call and CAIR take care of this issue. • Transport is only mentioned in the context of domain selection and boundary conditions. • Modeling domains will generally be large • Will be able to evaluate transport and the effect of emissions controls from upwind areas
Which Future Year to Model? • Assumed that last year of 3 year period ending in the ozone season before the attainment year will be modeled (model 2009 for an attainment date of 2010) • Language does not imply that an earlier modeling year is needed due to RACM • “… Since areas are required to attain as expeditiously as practicable and perform a RACM analysis, results of the analysis may indicate attainment can be achieved earlier, (e.g., 2008). In this case, the timing of implementation of control measures should be used to determine the appropriate projection year....... The selection of the future year(s) to model should be discussed with the appropriate EPA Regional Office as part of the modeling protocol development process.””
Weight of Evidence/Supplemental Analyses • The guidance recommends supplemental analyses for all attainment demonstrations. • Less emphasis on modeling (CAAAC recommendations) • Increased weight to emissions and ambient data trends and analyses • Weight of evidence range redefined as 82-87 ppb • 85 ppb becomes less of a bright line
Minimum RRF Theshold • Analysis found that the 70 ppb threshold was too low because the model was less responsive at predicted concentrations as low as 70 ppb (the old threshold). • Recommend increasing the minimum threshold to 85 ppb. • This removes some bias from the results and also makes the resulting RRF more stable.
Minimum RRF Theshold Example: Daily Ozone RRF vs. threshold at a monitor in Baltimore
Number of Days to Model • The draft guidance said to model “several days” at each monitor • The new recommended minimum is 10 days (with an absolute minimum of 5 days) • The number of days is based on an analysis which examined the variability of relative reduction factors (RRF) as a function of the number of days in the calculation. • The results show that 10 or more days provides for a relatively stable RRF.
Number of Days to Model Example: Variability of RRF as a function of the number of days in the calculation As the number of days in the calculation increases, the potential variability of the RRF decreases
Threshold/Number of Days • The minimum threshold and the number of days are combined to get a hierarchy of the number of days and thresholds used in any possible situation. • This will handle all cases where few days are being modeled and/or the modeled peaks are often below 85 ppb. • The minimum threshold can be as low as 70 ppb and the minimum number of days at each monitor can be as few as 5.
Next Steps • Continue work on the next draft of the PM2.5/Regional Haze guidance • Finish development of MAT/SMAT software • Includes spatial interpolations • Modeled adjusted spatial fields