Download
1 / 2
20 likes | 98 Views
Non-tumor < 6 M > 6 M and < 1Y > 1Y and < 2Y > 2Y. A). P = 0.0011. B).

E N D
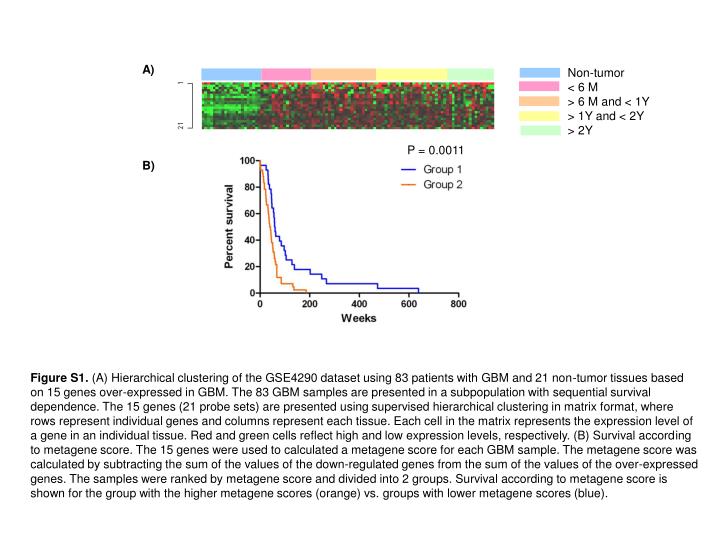
Non-tumor < 6 M > 6 M and < 1Y > 1Y and < 2Y> 2Y A) P = 0.0011 B) Figure S1. (A) Hierarchical clustering of the GSE4290 dataset using 83 patients with GBM and 21 non-tumor tissues based on 15 genes over-expressed in GBM. The 83 GBM samples are presented in a subpopulation with sequential survival dependence. The 15 genes (21 probe sets) are presented using supervised hierarchical clustering in matrix format, where rows represent individual genes and columns represent each tissue. Each cell in the matrix represents the expression level of a gene in an individual tissue. Red and green cells reflect high and low expression levels, respectively. (B) Survival according to metagene score. The 15 genes were used to calculated a metagene score for each GBM sample. The metagene score was calculated by subtracting the sum of the values of the down-regulated genes from the sum of the values of the over-expressed genes. The samples were ranked by metagene score and divided into 2 groups. Survival according to metagene score is shown for the group with the higher metagene scores (orange) vs. groups with lower metagene scores (blue).
< 6 M > 6 M and < 1Y > 1Y and < 2Y> 2Y P = 0.0034 Figure S2. (A) Hierarchical clustering of the TCGA GBM dataset using 254 patients with GBM based on 15 genes over-expressed in GBM. The 254 GBM samples are presented in a subpopulation with sequential survival dependence. The 15 genes (20 probe sets) are presented using supervised hierarchical clustering in matrix format, where rows represent individual genes and columns represent each tissue. Each cell in the matrix represents the expression level of a gene in an individual tissue. Red and green cells reflect high and low expression levels, respectively. (B) Survival according to metagene score. A metagene score was calculated as in Figure S1. Survival according to metagene score is shown for the group with the higher metagene scores (orange) vs. groups with lower metagene scores (blue).