Download
1 / 78
810 likes | 875 Views
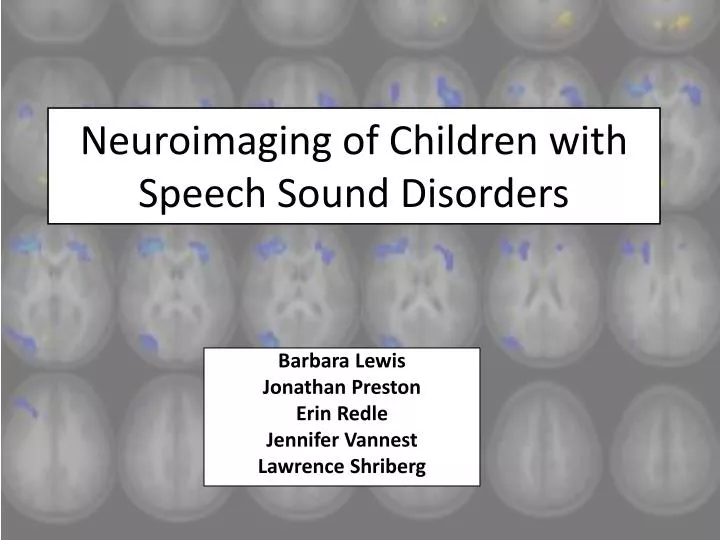
Neuroimaging of Children with Speech Sound Disorders. Barbara Lewis Jonathan Preston Erin Redle Jennifer Vannest Lawrence Shriberg. Outline of Presentation. Introduction to the Session- Dr. Lewis Basic Principles of fMRI - Dr. Vannest Study 1:

E N D
Neuroimaging of Children with Speech Sound Disorders Barbara Lewis Jonathan Preston Erin Redle Jennifer Vannest Lawrence Shriberg
Outline of Presentation • Introduction to the Session- Dr. Lewis • Basic Principles of fMRI- Dr. Vannest • Study 1: • Overview, participants, and paradigms – Dr. Redle • Madison CAS Phenotype – Dr. Shriberg • FMRI Study Results- Dr. Vannest • Study 2: Dr. Preston • Questions and Panel Discussion- All
Neuroimaging of Children With Speech Sound Disorders American Speech-Language-Hearing Association National Convention, Atlanta, GA November 16, 2012 Session Introduction Barbara Lewis, Ph.D. CCC-SLP Professor, Communication Sciences Case Western Reserve University bxl@case.edu
Imaging Genetics 1. Identify genes 2. Expression in Brain 3. Behavior
The Emerging Field of Imaging Genetics • Imaging genetics is the use of imaging technology as a phenotype to evaluate how genes that influence disorders are expressed in the brain. • Both genetics and environment are important in determining brain function. Integrating genetics with neuroimaging will improve our understanding of speech and language disorders. • There is a need for novel analytic, statistical and visualization techniques.
Genetic Architecture of a Complex Trait Environmental factors SSD, LI, or RD Neuroprocessing
Scope of the problem • Is there a link between • speech sound and language disorders and dyslexia? • Chromosomes 1, 3, 6, 15 [Grigorenko PNAS, Sept 3, 2003]
Linkage Results for Spoken Language and Written Expression (Lewis et al., 2011)
What are specific genes that may underlie speech sound disorders? • FOXP2: Located on 7q13; a brain expressed transcription factor that affects brain development; identified in the KE family (Liegeios et al., 2003). • ROBO1 and ROBO2:Located on chromosome 3; guides axons and influences neuronal axon growth; identified in dyslexics in Finland (Nopola-Hemmi et al., 2001). • KIAA0319, TTRAP, and DCDC2: Located on chromosome 6; genes disrupt neuronal migration; identified in dyslexic by numerous research groups (Grigorenko et al., 2000; Smith et al., 2007). • BDNF: Brain-derived neurotrophic factor related to nerve growth and differentiation in the brain (Stein, unpublished). • DYX8: Region on chromosome 1 that demonstrates pleiotropy for SSD and dyslexia (Miscamarra et. al., 2007). • Aromatase (CYP19A1): Located on 15q21.2 ; This gene regulates estrogen synthesis in specific brain areas. It is related to synaptic plasticity and axonal growth (Anthoni et al., 2012).
On the left, controls without a history of speech and language disorders show the expected activation in the language areas while repeating nonsense words. On the right, participants with a history of speech sound disorders show under activation of the language areas during repetition of nonsense words (Tkach et al., 2011).
Collaborative Study with CWRU, CCHMC, and U. Of Wisconsin • The first objective is to compare neural substrates used in speech motor planning and production, fine motor planning and praxis, and visual-auditory perception in children with CAS, with speech delay and with typically developing children. • The second objective is to determine how well current clinical measures correlate with observed neurophysiological differences in speech motor planning and production in children with CAS, speech delay and typically developing children. • The third objective is to determine how genes influence neural development result in neurological processing differences in children with CAS and speech delay as compared to typically developing children.
Clinical Implications • An improved understanding of the genetic and neurological underpinnings of CAS and speech delay will: • Identify the biological mechanisms that underlie both typical and disordered speech. • Aid in the early identification of children at risk for CAS and speech delay. • Facilitate the development of more specific and effective therapies. • Early identification and more effective therapies will result in improved long-term academic, occupational and social outcomes.
References • Anthoni, H., Sucheston, L.E., Lewis, B.A., Tapia-Paez, I., Fan, X., Zucchelli, M., Taipale, M., Stein, C.M. et al. (2012). The Aromatase Gene CYP19A1: Several genetic and functional lines of evidence supporting a role in reading, speech and language. Behavior Genetics, 42(4), 509-527. • Grigorenko, E. L. (2003). The first candidate gene for dyslexia: Turning the page of a new chapter of research. PNAS, 100 (20),11190-11192. • Grigorenko, E.L., Wood, F.B., Meyer, M.S., Hart, & Pauls, D.L. (2000). Chromosome 6 p influences on different dyslexia related cognitive processes: further confirmation. Journal of Human Genetics, 66, 715-723. • Liegeois, F., Baldeweg, T., Connelly, A., Gadian, D. G., Mishkin, M., & Vargha-Khadem, F. (2003). Language fMRI abnormalities associated with FOXP2 gene mutation. Nat Neurosci, 6(11), 1230-1237. • Lewis, B., Avrich, A., Freebairn, L., Hansen, A., Sucheston, L., Kuo, I., Taylor, H.G., Iyengar, S., Stein, C. (2011). Outcomes of children with speech sound disorders: Impact of endophenotypes. Journal of Speech Language and Hearing Research, 54, 1628-1643. • Lewis, B. A., Shriberg, L.D., Freebairn, L.A., Hansen, A.J., Stein, C.M., Taylor, H.G.& Iyengar, S.K. (2006). The genetic bases of speech sound disorders: evidence from spoken and written language. J. Speech Lang Hear. Res.49, 1294-1312. • Miscamarra, L., Stein, C.M., Millard, C., Kluge, A., Cartier, K.C., Freebairn, L.A. et al. (2007). Further evidence of pleiotropy influencing speech and language: Analysis of the DYX8 region. Human Heridity, 63, 47-58. • Nopola-Hemmi, J., Myllyluoma, B., Haltia, T., Taipale, M., Ollikainen, V., Ahonen, T., et al. (2001). A dominant gene for developmental dyslexia on chromosome 3. Journal of Medical Genetics, 38, 658-664.
References • Schmithorst, V. J., & Holland, S. K. (2004). Event-related fMRI technique for auditory processing with hemodynamics unrelated to acoustic gradient noise. Magn Reson Med, 51(2), 399-402. • Smith, S.D. (2007). Genes, language development, and language disorders. Mental Retardation and Developmental Disabilities Research Reviews, 13, 96-105. • Stein, C. M., Schick, J.H., Taylor, G.H., Shriberg, L.D., Millard, C., Kundtz-Kluge, A.et al. (2004). Pleiotropic effects of a chromosome 3 locus on speech-sound disorder and reading. Am. J. Hum. Genet.74, 283-297. • Stein, C. M., Miller, C., Kluge, A., Miscimarra, L.E., Cartier, K.C., Freebairn, L.A. et al. (2006). Speech Sound Disorder Influenced by a Locus in 15q14 Region. Behav. Genetics, 36(6), 858-868. • Tkach, J.A., Chen, X., Freebairn, L.A., Schmithorst, V.J., Holland, S.K., & Lewis, B.A. (i2011). Neural Correlates of Phonological Processing in Speech Sound Disorder: A Functional Magnetic Resonance Imaging Study, Brain and Language. 119,42-49.
Basic Principles of fMRI Neuroimaging of Children With Speech Sound Disorders American Speech-Language-Hearing Association National Convention, Atlanta, GA November 16, 2012 Jennifer Vannest, Ph.D. Assistant Professor, Division of Neurology Assistant Director, Pediatric Neuroimaging Research Consortium Cincinnati Children’s Hospital Medical Center jennifer.vannest@cchmc.org
Background: Functional Imaging • Based on the assumption that the brain is “functionally segregated” • isolate a particular process experimentally • examine relative changes in neural activity – a comparison between “active” and “baseline” conditions • E.g. listening to speech vs. listening to noise
Magnetic Resonance Imaging (MRI) • Participant is placed in a strong magnetic field • Radio transmitter/receiver around area to be imaged • Safety concerns: magnetic items will be drawn to the center of the magnet • Many other substances (especially metals) can cause distortions in images • Electromagnetic interference in environment • Significant acoustic noise
White matter, grey matter and cerebrospinal fluid have 3 different magnetic properties. This allows the 3 different kinds of tissue to be separated with MRI. • Gradients in the magnetic field are used as a “grid” to localize regions of tissue
Functional MRI Process of interest -> Neuronal Activity -> Increased Metabolism and Bloodflow -> Increased Deoxygenated blood Deoxygenated blood has magnetic properties and creates local changes in the magnetic field BOLD response: Blood Oxygen Level - Dependent
Functional data • Relatively low spatial resolution (for MRI) • Sensitive to BOLD response • 1 brain volume takes 2 sec to acquire • Scan for 5-7 minutes • Alternate between active and baseline conditions Structural Data • High spatial resolution • 1 brain volume takes 6 min to acquire
fMRI: Experimental Design Issues Because of the slow timing of the hemodynamic response, we try to optimize the design of fMRI experiments to be as sensitive as possible to relative increases in bloodflow. Stimulus 13s We also must take into account behavioral characteristics of the task during active and baseline conditions 6s 2s
fMRI: Experimental Design Issues “HUSH” or “Sparse” techniques take advantage of the slow timing of the hemodynamic response Stimulus 13s Stimulus/response occurs in silent interval, then images are acquired 6s 2s image 1 2 3
fMRI: Data Analysis • Motion correction • Group analysis • Normalize all participants’ brains to the same size • Look for voxels that have consistently greater BOLD response in the active versus baseline condition across all participants (statistically significant) • Correction for multiple comparisons across voxels • BOLD response can also be correlated with a behavioral measure • Comparisons between groups
fMRI: Speech and Language Networks Price (2010)
References • Culhman, J. (2012, January 31). fMRI 4 newbies: A crash course in brain imaging. Retrieved from http://culhamlab.ssc.uwo.ca/fmri4newbies/ • Price, C.J. (2010). The anatomy of language: a review of 100 fMRI studies publishedin 2009. Annals of the New York Academy of Sciences, 1191, 62-88.
Study 1: Functional Magnetic Resonance Imaging (fMRI) Study of Speech Production in Childhood Apraxia of Speech
Grants Acknowledgement • This research was supported by grants from the National Institutes of Health, National Institute on Deafness and other Communication Disorders including DC000528, DC00496, and DC010188-02.
Pediatric Neuroimaging Research Consortium Collaborating Laboratories • Case Western Reserve University • Barbara Lewis, PhD Lisa Freebairn, M.A. Jessica Tag, M.A. • Gerry Taylor, Ph.D. • SudhaIyengar, PhD • Catherine Stein, Ph.D. • Allison Avrich B.S. • Robert Elston, PhD • Feiyou Qui, MS • University of Wisconsin Madison • Lawrence D. Shriberg, PhD • Cincinnati Children’s Hospital Medical Center • Erin Redle, PhD • Jennifer Vannest, PhD • Jean Tkach, PhD • Scott Holland, PhD • Thomas Maloney, M.S. • .
Neuroimaging of Children With Speech Sound Disorders American Speech-Language-Hearing Association National Convention, Atlanta, GA November 16, 2012 Overview, Participants, and Paradigms Erin E. Redle, Ph.D. CCC-SLP Division of Speech PathologyAssistant Professor, Communication Sciences Research CenterQuality Scholar, James M. Anderson Center for Health Systems ExcellenceCincinnati Children's Hospital Medical Center erin.redle@cchmc.org
Background • SSDs, including CAS, arise from differences in neural substrates supporting speech production • Several neuroimaging studies of the KE family (severe SSD, FOXP2 gene mutation) • Structural imaging found gray matter volume differences in Broca’s area, pre-supplementary motor area (SMA), the caudate nucleus, and the lentifromnucleus in affected vs. non-affected family members (Vargha-Khadem et al., 1998) • Functional imaging also found differences in Broca’sarea during over and covert speech tasks between affected and non-affected family members (Liegeoiset al., 2003) • Tkach et al., 2011 • Preston et al., 2012 • Better understanding of disorders may lead to more targeted and more effective interventions
Participants • Children 5-12 years • Typical Speech Development (TSD) • Speech Sound Disorder • Speech Delay or Motor Speech Disorder- Not Otherwise Specified (MSD-NOS) • CAS • Recruitment Sources • Neurodevelopmental Apraxia Clinic • Division of Speech Pathology • Community
Participants • Inclusionary/exclusionary criteria • All participants: • No known co-occurring neurological disorder, genetic disorder, hearing loss, history of cleft, chronic medical condition that would impact speech or language • ADHD is not exclusionary • Right-handed • TSD: No diagnosed developmental disorder at any time history • SSD: • Language: Able to complete all scanning/testing activities
Scanning • Overview of methods with young children • Before the visit • Video • Practice • Pre-scan prep • Review behavioral tasks • Mock scanner • Quick tour of scanner room
Scanning Entering the scanner SLOW process, parents in scan room has varying effectiveness Child “controls” the “spaceship” and “pilots” the spaceship with the buttons for raising and lowering the “Captain’s Seat” Emergency button practice Sit on the scanner bed, sit next to them if needed Child tries the headphones on Child talks to an adult through the headphones the child talks back so that they know they can communicate Offer blanket, Children often don’t know how to say or don’t want to say that the temperature is uncomfortable During the scan Make sure that they can see the movie (the projector is on) Never ask the child if they are doing OK, tell them that they are doing a great job and ask if there is anything they want to tell us or if we can make them more comfortable If the child gets upset while in the scanner, have them go see their parent and they may be willing to go back in
Scanning Protocol • Total approximately 45-50 minutes • Anatomical scans (movie) • Functional scans (games) • Syllable repetition task (x2)(SRT) • Non-word imaging task (NIT) • Fine motor praxis task (FMPT) • Diffusion tensor imaging (movie)
Syllable Repetition Task (Shriberg& Lohmeier, 2008; Shriberg et al., 2009; Lohmeier & Shriberg, 2011; Shriberg, Lohmeier, et al., 2012) • During the SRT the child repeats phonetically simple phonemes (/b, d, m, n, ɑ/) in syllables • Syllables increase in length from 2-4 syllables (e.g. /bɑdɑ/ ‘bada’) • Phonetically simple phonemes chosen to eliminate confounding elements of many non-word repetition tasks; easier phonemes support accurate production • Attempts to minimize performance as an confounder • 18 spoken items, 18 listen items, HUSH acquisition • Active condition of repetition contrasted with listening • Responses recorded and scored
Sequence /bɑdɑ/ + “/bɑdɑ/” Repeat Condition Images acquired 11 seconds per trial (silence) Images acquired + Listen Condition
Fine Motor Praxis Task • Novel task, developed to assess more complex finger tapping • Hear sequence of 1-4 tones, bilaterally tap successive fingers to thumb matching the number of tones • Contrasted with listening • Total of 18 tapping trials, 18 listen trials • Block acquisition
Sequence Images acquired + Go Fingers tap Tap Condition Hands are still + Listen Condition
Behavioral Testing • Speech • Goldman Fristoe Test of Articluation-2 (GFTA-2) (Goldman & Fristoe, 2000) • Oral Speech Motor Screening Examination-3 (Louis & Ruscello, 2000) • Selected components of the Madison Speech Assessment Protocol, including a conversational analysis • Language • Clinical Evaluation of Language Fundamental-4 (CELF-4) Core Test (Semel, Wiig, & Secord, 2003) • Comprehensive Test of Phonological Processing (CTOPP) (Wagner, Torgesen, & Rashotte, 1999) • Test of Auditory Processing Skills-3 (TAPS-3), Discrimination sub-test only (Martin & Brownell, 2005) • Wechsler Abbreviated Test of Intelligence (WASI) (Wechsler, 2003) • Purdue Pegboard • School Function Assessment (SFA) (Coster, Deeney, Haltiwanger, & Haley, 1998) • Parents complete a case history • Hearing screening
Summary of Participants • Total of 27 children completed scanning • 11 TSD (7.7 years, range 6-10, males=7) • 16 SSD (7.1 years, range 5-9, males=11) • Behavioral testing* • 10 of 11 TSD completed • 15 of 16 SSD completed
Table 1Speech and Language Testing Results for Children in the TSD and SSD Groups Compared Using Two-tailed t-Test (with Standard Deviations in Parentheses)* * p <.05, ** p<.01
Table 2Intelligence Testing Results for Children in the TSD and SSD Groups Compared Using Two-tailed t-Test (with Standard Deviations in Parentheses)* * p <.05, ** p<.01
Table 3Fine Motor Dexterity and Functional Fine Motor Performance Test Results for Children in the TSD and SSD Groups Compared Using Two-tailed t-Test (with Standard Deviations in Parentheses)* * p <.05, ** p<.01
Table 4SRT Results for Children in the TSD and SSD Groups During Scanning Compared Using Two-tailed t-Test (with Standard Deviations in Parentheses)* * p <.05, ** p<.01
References • Coster, W., Deeney, T., Haltiwanger, J., & Haley, S. (1998). School Function Assessment. San Antonio, TX: The Psychological Corporation. • Goldman, R., & Fristoe, M. (2000). Goldman-Fristoe Test of Articulation-Second Edition. Circle Pines, MN: American Guidance Services, Inc. • Lohmeier, H.L. & Shriberg, L.D. (2011). Reference Data for the Syllable Repetition Task (SRT) (Tech. Rep. No. 17). Phonology Project, Waisman Center, University of Wisconsin-Madison. • Louis, K. O., & Ruscello, D. (2000). Oral Speech Mechanism Screening Examination- Third Edition. Dallas, TX: Pro-Ed. • Shriberg, L.D. & Lohmeier, H.L. (2008). The Syllable Repetition Task (Tech. Rep. No. 14). Phonology Project, Waisman Center, University of Wisconsin-Madison. • Shriberg, L.D., Lohmeier, H.L., Campbell, T.F., Dollaghan, C.A., Green, J.R., & Moore, C.A. (2009). A nonwordrepetition task for speakers with misarticulations: The Syllable Repetition Task (SRT). Journal of Speech, Language, and Hearing Research, 52, 1189-1212. • Shriberg, L.D., Lohmeier, H.L., Strand, E.A., & Jakielski, K. J. (2012). Encoding, memory, and transcoding deficits in Childhood Apraxia of Speech. Clinical Linguistics & Phonetics, 26, 445-482. • Tkach, J.A., Chen, X., Freebairn, L.A., Schmithorst, V.J., Holland, S.K., & Lewis, B.A. (i2011). Neural Correlates of Phonological Processing in Speech Sound Disorder: A Functional Magnetic Resonance Imaging Study, Brain and Language. 119,42-49. • Vargha-Khadem, F. et al. (2005). FOXP2 and the Neuroanatomy of Speech and Language. Nature (6), 131-138. • Wechsler, D. (2003). WISC-IV: Wechsler Intelligence Scale for Children-Fourth Edition. San Antonio, TX: PsychCorp(Harcourt Assessment).
Madison CAS Phenotype: Premises, Methods, and Classifications Lawrence D. Shriberg Waisman Center University of Wisconsin-Madison Neuroimaging of Children With Speech Sound Disorders American Speech-Language-Hearing Association National Convention, Atlanta, GA November 16, 2012
Madison CAS Phenotype: Four Premises