Download
1 / 28
280 likes | 587 Views
Course on Biostatistics. Instructors – Dr. Małgorzata Bogdan Dr. David Ramsey Institute of Mathematics and Computer Science Wrocław University of Technology Poland. Course on Biostatistics. Two parts 1. Locating genes influencing quantitative traits in experimental populations.

E N D
Course on Biostatistics • Instructors – • Dr. Małgorzata Bogdan • Dr. David Ramsey • Institute of Mathematics and Computer Science • Wrocław University of Technology • Poland
Course on Biostatistics • Two parts • 1. Locating genes influencing quantitative traits in experimental populations. • 20.03-30.03. 2006, Małgorzata Bogdan • 2. Population Genetics • 22.05-2.06.2006, David Ramsey
Grading • Students can gain 50 points for each part of the course (25 for a project, 25 for an exam). • The final grade will be based on the total percentage. • To pass the course the student has to gain at least 15 points for each part of the course and at least 50 points in total.
First part • Locating genes influencing quantitative traits in experimental populations. • 20.03-30.03. 2006 Małgorzata Bogdan
Course Outline • Introduction to genetics and experimental populations. • Basic methods of locating quantitative trait loci (QTL). • Locating QTL with QTL Cartographer.
Helpful materials • Text book • Genetics and Analysis of Quantitative Traits by Michael Lynch and Bruce Walsh • Software – Windows QTL Cartographer • S.Wang, C.J. Basten, Z-B. Zeng • Program in Statistical Genetics, North Carolina State University • Can be downloaded from • http://statgen.ncsu.edu/qtlcart/WQTLCart.htm
Main Goal • Learn how to locate regions of the genome hosting genes influencing some quantitative traits (Quantitative Trait Loci – QTL). • Statistical methods – mainly linear models.
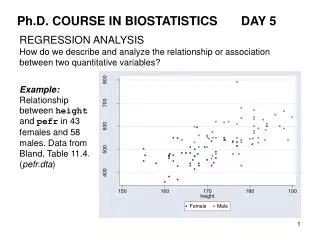
Introduction to Genetics DNA - A nucleic acid that carries the genetic information in the cell. DNA consists of two long chains of nucleotides joined by hydrogen bonds betweenthe complementary bases adenine and thymine or cytosine and guanine. The sequence of nucleotides determines individual hereditary characteristics. http://www.answers.com/topic/dna
Introduction to Genetics • Chromosome – a ‘’long’’, continuous piece of DNA, which contains many genes, regulatory elements and other intervening nucleotide sequences. • Diploid organisms – chromosomes appear in pairs (one from each parent)
Allele - any of two or more alternative forms of a gene that occupy the same locus on a chromosome. • Example: allele of blue eyes, allele of brown eyes • Genotype at a single locus: the pair of alleles that individual carries at the locus.
The Hardy-Weinberg principle • Random mating • pa- frequency of a allele • pA- frequency of A allele • P(aa)=p2a • P(aA)=2papA • P(AA)=p2A
Phenotype – observed or measured characteristic (or trait) for an individual. • We will be dealing with quantitative traits like eg. height, yield, blood pressure etc.
Heritability • Z - the phenotypic (trait) value of an individual • G – the genotypic value (the sum of the total effects of all loci on the trait) • E – an environmental deviation • Z = G + E • Broad sense heritability (population parameter) • H2 = Var (G) / Var (Z)
Fisher’s decomposition of the Genotypic Value • Consider a biallelic locus with alleles a, A • N – number of alleles ’’a’’ for a given individual (gene content) • We regress G on N • Var(G) = 2A+ 2D
Trait Influenced by Two Loci • Gijkl – mean phenotype for individuals with genotypes (i j; k l) • αi = Gi…- G - additive effect of i allele • δij = Gij..- G - αi - αj - dominance effects at the first locus • δkl = Gkl..- G - αk - αl - dominance effects at the second locus
Possible interactions (epistasis) • (αα)ik=Gi.k.- G – αi – αk • (αδ)ikl= • Gi.kl.- G – αi – αk – αl – δkl- (αα)ik- (αα)il • (δδ)ijkl= Gijkl.- G – αi – αj – αk – αl – δij - δkl - (αα)ik- (αα)il-(αα)jk- (αα)jl - (αδ)ikl-(αδ)jkl -(αδ)ijk-(αδ)ijl
Example (Lynch and Walsh) • Teosinte – wild progenitor of cultivated maize • Two loci (markers) - UMC107 , BV302 • UM, BM – maize alleles • UT, BT – teosinte alleles • Trait – the average length of the vegetative internodes in the lateral branch (in mm)
Genetic maps Markers – genetic loci which express experimentally detectable variation between individuals. Genetic map gives an order of markers on a chromosome and a distance between them. 1 Morgan – the expected value of the number of crossovers is equal to 1
A B B P: x F1: AB x low fat content a b q c d a b q c d high fat content A B Q C D A B Q C D A B Q C D A B Q C D a bq c d A B Q C D BC: a bq c d A B Q C D aBQCd A B Q C D A B Q C D A B Q C D A Bq c d A B Q C D