Download
1 / 30
300 likes | 440 Views
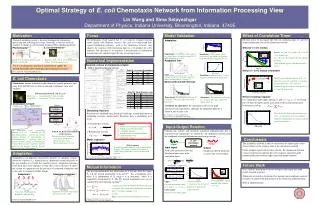
Information Processing by the E. coli Chemotaxis Network. Sima Setayeshgar, Lin Wang Indiana University Funding: NSF, IU MetaCyt, IU FRSP. AMS Central Sectional Meeting Special Session on Applications of Stochastic Processes to Cell Biology University of Notre Dame November 6, 2010.

E N D
Information Processing by theE. coli Chemotaxis Network Sima Setayeshgar, Lin Wang Indiana University Funding: NSF, IU MetaCyt, IU FRSP AMS Central Sectional Meeting Special Session on Applications of Stochastic Processes to Cell Biology University of Notre Dame November 6, 2010
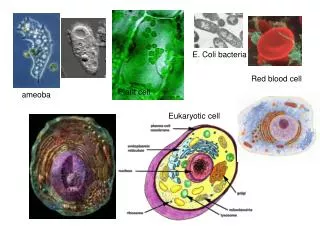
Information Processing by Biochemical Signaling Networks Biochemical signaling is the most fundamental level of information processing in biological systems, where an external stimulus is measured and converted into a response. Molecule counting in chemotaxis[1] Photon counting in vision[2, 3] Photon Attractant Δ[Ca2+], Δ[Na+], etc. Δ[CheY-P] Response of E. coli to change in external attractant concentration Response of Drosophila photoreceptor cell to change in photon concentration [1] S. M. Block et al. Cell 31, 215-226 (1982) [2] R. C. Hardie et al. Nature 413, 186-193 (2001) [3] M. Postma et al. Biophysical Journal 77, 1811-1823 (1999)
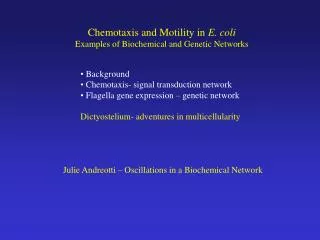
Chemotaxis in E.coli Fluorescently labeled E. coli (from Berg lab) Physical constants: Cell speed: 20-30 μm/sec Mean run time: 1 sec Mean tumble time: 0.1 sec Dimensions: Body size: 1 μm in length 0.4 μm in radius Flagellum: 10 μm long 45 nm in diameter
Outline Information-theoretic analysis of realistic, stochastic computational model of the E. coli chemotaxis network • Network filters: integrator, differentiator • Input-Output (I/O) relations for Gaussian distributed input signals with fast and slow correlation times • Mutual Information (MI) between input signal and motor output • Comparison with minimal network model S. Setayeshgar - AMS Central Sectional Meeting
Simulation of Network Response Single motor response: constant stimulus Data (from [4]) Simulation Simulation CheY-P response to step change [4] E. Korobkova et al. Nature 428, 574 (2004) S. Setayeshgar - AMS Central Sectional Meeting
CheY-P and Motor Response to Input Signal Input Signal: • m = 5 mM • s/m = 0.41 • t = 0.3 s Response: CW CCW CCW CW S. Setayeshgar - AMS Central Sectional Meeting
Network Response: Noise • Input Signal: • m = 5 mM • s/m = 0.41 • t = 0.3 s Response: 20 independent simulations w/ above input signal Red: CW CCW transitions Blue: CCW CW transitions S. Setayeshgar - AMS Central Sectional Meeting
Input-Output Relations S. Setayeshgar - AMS Central Sectional Meeting
Slow Signal t = 3 sec S. Setayeshgar - AMS Central Sectional Meeting
Fast Signal where [5] N. Brenner et al., Neuron (2000) [6] A. L. Fairhall et al., Nature (2001) Spike-Triggered Covariance Analysis (STC)[5],[6] Construct: S. Setayeshgar - AMS Central Sectional Meeting
m = 5 mM • s/m = 0.41 • t = 0.3 s Left plots: CW CCW Right plots: CCW CW (a), (e) Density plots of DC (b), (f) Eigenvalues (c), (g) Dominant eigenvectors (d), (h) Dominant eigenvectors, after correction for input signal correlation time
Dimension Reduction v1: “integrator” v2: “differentiator” I/O Relations: Signal projection onto leading directions: S. Setayeshgar - AMS Central Sectional Meeting
t = 0.3 s Left plots: CW CCW Right plots: CCW CW • r(s1) • r(s2)
Rescaling of Input-Output Relations S. Setayeshgar - AMS Central Sectional Meeting
Slow Signal: t = 3s • = 3 mM (blue) • = 5 mM (green) • = 7.5 mM (magenta) • = 10 mM (black) • s/m = 0.25 (all) • (a), (c) Raw I/O relation • (b), (d) Rescaled CCW CW CW CCW Rescaling: normalize input concentration by standard deviation after subtracting mean. I/O relations for inputs with common s/m collapse! S. Setayeshgar - AMS Central Sectional Meeting
Fast Signalt = 0.3s • = 3 mM (blue) • = 5 mM (green) • = 7.5 mM (magenta) • = 10 mM (black) • s/m = 0.41 (all) • (a), (e) Raw I/O relation r(s1) • (b), (f) Rescaled • (c), (g) Raw I/O relation r(s2) • (d), (h) Rescaled I/O relations for inputs with common s/m collapse! S. Setayeshgar - AMS Central Sectional Meeting
Mutual Information Approximated as Mutual Information conveyed by dominant filters S. Setayeshgar - AMS Central Sectional Meeting
MI: Numerical Results Solid points/line: use joint probability distribution with both filters Open points/line: treat filters as independent • Observations: • Mutual information is maintained for input signals with common s/m, independent of m over range KD (inactive) < c < KD (active) • Mutual information increases with increasing s/m. S. Setayeshgar - AMS Central Sectional Meeting
Summary • Application of STC analysis to information processing by non-neuronal biochemical sensory system • Dominant network filters: averaging, differentiating • Adaptation of network I/O relations to input statistics (m,s): contrast adaptation • Mutual Information maintained for signals with the same s/m S. Setayeshgar - AMS Central Sectional Meeting
Backup slides S. Setayeshgar - AMS Central Sectional Meeting
Backup slides Chap 6 slow io sameU dif S S. Setayeshgar - AMS Central Sectional Meeting
Chap 6 slow io dif U same S S. Setayeshgar - AMS Central Sectional Meeting
Chap 6: Rs_dif U same S S. Setayeshgar - AMS Central Sectional Meeting
E. coli Chemotaxis Signaling Network Stimulus Signal Transduction Pathway [CheY-P] Motor Response Flagellar Bundling Motion (Courtesy of Howard Berg lab) S. Setayeshgar - AMS Central Sectional Meeting
Chap 6 S. Setayeshgar - AMS Central Sectional Meeting
Chap 6 S. Setayeshgar - AMS Central Sectional Meeting
Chap 6 S. Setayeshgar - AMS Central Sectional Meeting
Minimal Model Minimal model S. Setayeshgar - AMS Central Sectional Meeting
Lin’s chap 7 (minimal model) S. Setayeshgar - AMS Central Sectional Meeting
Channel capacity Lin’s chap 7 minimal model, channel capacity S. Setayeshgar - AMS Central Sectional Meeting