Download
1 / 35
350 likes | 358 Views
Portable Fuel Container Spillage Control Project. Monitoring and Laboratory Division June 28, 1999. California Environmental Protection Agency. Air Resources Board. Portable Fuel Container Spillage Control Workshop. Changes in the Proposed Regulations

E N D
Portable Fuel Container Spillage Control Project Monitoring and Laboratory Division June 28, 1999 California Environmental Protection Agency Air Resources Board
Portable Fuel Container Spillage Control Workshop • Changes in the Proposed Regulations • Proposed Test Methods for Spill-Proof Systems • Draft Refueling Spillage Test Data • Permeation and Barrier Feasibility Test Data • Estimated Effectiveness of Spill-Proof Systems • Population/Activity/Emissions Inventory • Estimated Price Increases for Spill-Proof Systems • Regulatory Process • More Information
Proposed Portable Fuel Container Spillage Control Regulations • Proposed Regulations apply to both portable fuel containers and spouts • Section 2472. Performance Standards for Spill-Proof Systems and Spill-Proof Spouts • Section 2472 (a)&(b). Three flow rate standards based on container size (e.g., 1/2 gallon/minute for containers 1.25 gallons) • Section 2472. Permeation Standard of 0.4 grams/gallon/day
Proposed Portable Fuel Container Spillage Control Regulations (continued) • Section 2473. Exemptions, rapid refueling devices for off-road motorcycle competitions & portable fuel tanks for outboards • Section 2475. Flow rate labeling requirement • Section 2477. Test Methods for determining compliance with Performance Standards
Section 2477. Test Methods • Test Method 510 - Automatic Shut-Off Test Procedure • Test Method 511 - Automatic Closure Test Procedure • Test Method 512 - Flow Rate Test Procedure • Test Method 513 - Permeation Test Procedure
Test Method 510 - Automatic Shut-Off • Fill container with water and invert for 5 minutes to check for leaks • Dispense contents into a 1/2 gallon test fixture • Fill test fixture to at least 1 inch from the top of the opening (± 1/8”) without overflowing • Repeat the process 3 times
Test Method 511 - Automatic Closure • Apply Test Method 510 protocol except fill the test fixture to approximately 50% of capacity • Hold the inverted container over the test fixture for 30 seconds to check for leaks and proper function of automatic closure • Pressurize container to 10 psig with the spout installed, leave undisturbed for 24-hours and record any pressure loss • Maximum allowable 24-hour pressure loss is 1 psig
Test Method 512 - Flow Rate Test Procedure • Fill container to its nominal capacity with water and invert for 5 minutes to check for leaks • Determine the amount of time to dispense all but approximately 1 pint of the liquid • Determine the mass of liquid dispensed by pre and post weighing the container • Calculate a flow rate in gallons/minute using the density of water at 25°C • Test each container 3 times to determine the average flow rate
Test Method 513 - Determination of Permeation Rates • Precondition containers with gasoline for a minimum of 4 weeks • Empty and re-fill containers with CERT fuel, seal, leak test, then expose to a 24-hour variable temperature profile • Weigh containers every 24-hours to determine the permeation rate gravimetrically • Must verify weight loss is linear (steady state) • Average of 5 consecutive 24-hour diurnal cycles used to determine the final rate
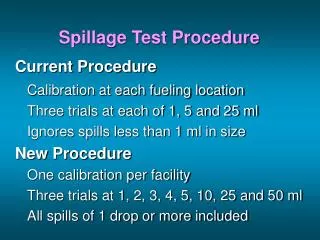
Refueling Spillage Test Procedure • Randomly selected ARB employees using conventional containers and spouts fill a 2400 ml fuel tank • Each participant performs several trials with randomly selected containers • Mass of the fuel dispensed is determined by pre and post weighing the containers
Draft Refueling Spillage Test Data • Out of 56 events, 25 included refueling spillage (45%) • Average per spillage event (less displaced vapor) =16.4 grams • Total fuel dispensed - 51.1 gallons • Testing will continue through July 2nd, final results will be posted on our web site
Permeation and Barrier Feasibility Tests • Average permeation rates determined from testing untreated HDPE containers • Treated containers also tested to determine the effectiveness of barrier surface treatments • Containers ranged in size from 1.25 gallons to 6.6 gallons and included products from 5 different manufacturers • Containers were tested with Phase II California Reformulated Certification (CERT) fuel • Select containers were also tested with a blend of Carbob and fuel grade ethanol (5.7% mass) • Barrier surface treatments included Sulfonation & 2 levels of Fluorination (levels 3 & 5)
Permeation and Barrier Surface Treatment Feasibility Test Data
Average Permeation Rates for Untreated Containers • 1.25 gallons - 1.52 g/gal/day • 2.06 gallons - 1.88 g/gal/day • 2.5 gallons - 1.46 g/gal/day • 5 gallons - 1.43 g/gal/day • 6.6* gallons - 1.09 g/gal/day • Average Permeation Rate - 1.57 grams/gallon/day
Average Permeation Rates Proposed Standard
Estimated Effectiveness of Spill-Proof Systems • Reduce diurnal emissions by 75% • Eliminate refueling spillage - 100% • Eliminate transport and storage losses - 100% • Reduce average permeation rates by 75% • Collects 45% of displaced vapors
Portable Fuel Container (Gas Cans) Population/Activity/Emissions Inventory Mobile Source Control Division June 28, 1999 California Environmental Protection Agency Air Resources Board
Statewide Population and Activity of Gas Cans • Determined through surveys • Residential Survey • Commercial Survey
Residential Population/Activity Parameters • % of households with gas cans - 46% • # of gas cans per household - 0.8 • % of gas cans stored empty - 30% • Average gas can capacity - 3.0 gallons • Average age of gas can - 5.5 years • Plastic and metal gas cans ratio - 76:24
Residential Population/Activity Parameters (Continued) • % Plastic cans with closed system - 53% • % Plastic cans with open system - 23% • % Metal cans with closed system - 13% • % Metal cans with open system - 11%
Commercial Population/Activity Parameters • # of gas cans per business - 6.9 • Average gas can capacity - 3.4 gallons • Average age of gas cans - 1.34 years • Plastic and metal gas cans ratio - 72:28
Commercial Population/Activity Parameters (Continued) • % Plastic cans with closed system - 33% • % Plastic cans with open system - 39% • % Metal cans with closed system - 18% • % Metal cans with open system - 10%
Gas Can Population Estimates • Residential gas can population - 9 million • Expansion Factor - # of housing units by county obtained from California State Department of Finance • Commercial gas can population - 400,000 • Expansion Factor - # of businesses which may have gas cans from InfoUSA database
Various Emissions Related Processes Associated with Gas Cans • Diurnal Loss - Ambient Temperature • Permeation Loss - Pressure and gas can material • Spillage - During refueling of equipment • Vapor Displacement - During refueling of equipment
Permeation Emission Rates • 1.57 grams per gallon per day • Obtained through gravimetric testing of several gas cans
Diurnal Emission Rates (Draft) • Several cans under different conditions were tested using Sealed Housing Evaporative Determination method. • Plastic/closed system - 2.15 g/gal/day • Plastic/open system - 21.76 g/day • Metal/closed system - 2.15 g/gal/day • Metal/open system - 21.76 g/gal/day
Spillage and Vapor Displacement Emission Rate • 17.3 g/refueling - obtained from USEPA’s NEVES report • Vapor displacement - 4.52 g/gal • Waiting for Data
Estimated Prices of Spill-Proof Systems • Average price increase per Spill-Proof System estimated between $5.50 - $8.00 per container • Estimate compares retail prices of similarly constructed containers • Breaks containers into 3 size categories, 1-1.5 , 2-2.5, 5-6 gallons • Pre-Regulation retail estimates of fuel containers are: • 1-1.5 gallon - $3.24 • 2-2.5 gallon - $4.69 • 5-6 gallon - $9.99
Regulatory Process • Workshop June 28, 1999 • Consider all comments received by July 9, 1999 • Staff Report - August 6, 1999 • Start of 45 day public comment period • Board Hearing - September 23, 1999
More Information On The Emissions Inventory • www.arb.ca.gov/msprog/spillcon/inventor.htm • Archana Agrawal, Manager, Inventory Assessments Section (626) 450-6136 • aagrawal@arb.ca.gov
More Information On The Regulation • www.arb.ca.gov/msprog/spillcon/spillcon.htm • Workshop presentation will be posted on the web site • Dean Bloudoff (916) 263-2070 • dbloudof@arb.ca.gov

![Daily Spillage [current]](https://cdn1.slideserve.com/2524880/daily-spillage-current-dt.jpg)