Download
1 / 12
120 likes | 239 Views
Relations between concurrent hard X-ray sources in solar flares M. Battaglia and A. O. Benz. Presented by Jeongwoo Lee NJIT/CSTR Journal Club 2007 October 11. Institute of Astronomy, ETH Zurich, Switzerland. Context.

E N D
Relations between concurrent hard X-ray sources in solar flaresM. Battaglia and A. O. Benz Presented by Jeongwoo Lee NJIT/CSTR Journal Club 2007 October 11 Institute of Astronomy, ETH Zurich, Switzerland
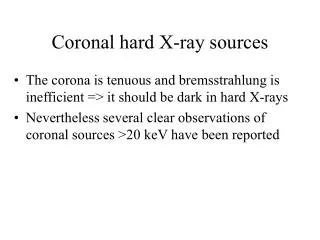
Context Solar flares release a large fraction of their energy into non-thermal electrons. Therefore, observations in X-rays might help. Looptop vs. Footpoint HXR sources: • Hoyng et al. (1981) - thick target bremss. emission • Masuda et al. (1994) – found a looptop source • Alexander & Metcalf (1997)-the looptop source has T+NT which is harder than the footpoint spectrum. • Petrosian et al. (2002)-the looptop source is softer than the footpoints by ~1. Time behavior of the HXR flux: • SHS: Parks & Winckler 1969, Kane & Anderson 1970 • SHH: Frost & Dennis 1971
Aims • Is the SHS-behavior a feature of the acceleration mechanism? • A transport effect produced by collisions or return currents? • Could it be a change in the dominating X-ray source from the coronal source (soft) to the footpoints (hard) and back to the coronal source (soft) again? The previous studies have been made using full sun spectra. The Ramaty High Energy Solar Spectroscopic Imager (RHESSI, Lin et al. 2002) provides the possibility of imaging spectroscopy. Emslie et al. (2003) analyzed a very large event with 4 HXR-sources observed by RHESSI to find that the spectral indices of the footpoints differ notably and accredit this to collisional losses by different column densities in the loop connecting the footpoints to the coronal source. What about other RHESSI events?
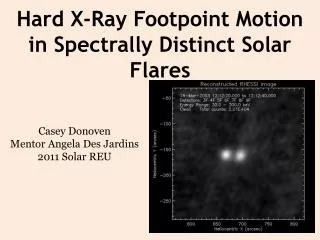
Fig. 1. Clean images (using detectors 3–8) of each event in the 34–38 keV energy range. The 60 and 80% contours at energies 10–12 keV (white) and the regions of interest (grey) are given. The footpoints have been arbitrarily numbered (1 and 2). The solar limb is indicated where in the field of view.
Figure 2: Spectra of footpoints and coronal source for the time interval 14:16:48-14:17:36 of the event of July 13th 2005. The energy range for the spectral fitting is indicated by the dotted lines. The thin solid line gives an estimate for the noise level.
Figure 3: Time evolution of spectral index of 3 sources for different choices of detectors and regions of interest. Solid - full sun Dotted - with detector 3 Dot-dashed - w/o detector 3, (same ROIs as dotted) Dashed - w/o detector 3, (different ROIs) Long dashes - images with natural weighting of detectors.
Fig. 7. Time evolution of the difference between spectral indices of the 3 sources
Figure 9: Flux vs. spectral index during the Nov. 1, 2003 event. The spectral index of the full sun spectra Non-thermal flux F35 fitted to the spectrum of the coronal source Summed flux of both footpoints
Conclusion • SHS in full sun observations cannot be explained by a time-dependent change of the dominant source. • SHS is a feature of all (footpoint and looptop) sources, and thus possibly of the accelerator itself. • The difference in spectral index between the non-thermal coronal and footpoint emission is not 2 for individual events. Δγ<2 may be explained by an intermediate situation between the two extremes. The plasma of the coronal source could act as thick target for low energetic electrons and as thin target for higher electron energies. Δγ > 2 require a filter effect in the propagation preferentially reducing the distribution at lower energies. Such a filter may be collisions or an electric field.
Conclusion-continued • In one out of 5 events the two footpoints have significantly different spectral indices, Δγ = 0.33 ± 0.04. The difference is constant during the event, although the spectral indices vary in time. Again, an energy filter during propagation seems to be at work, differing in one flare for the two legs of the loop. The temporal and spectral relation of the coronal source to the footpoints suggests an intricate connection between corona and chromosphere. The result supports the idea that flare energy release and particle acceleration are closely related to the coronal source.