Download
1 / 3
30 likes | 140 Views
For a permutation test, we have H 0 : F 1 (x) = F 2 (x) vs H a : F 1 (x) <= F 2 (x) Note this alternative means that the density of the first population is larger than that of the second... sketch to see this!

E N D
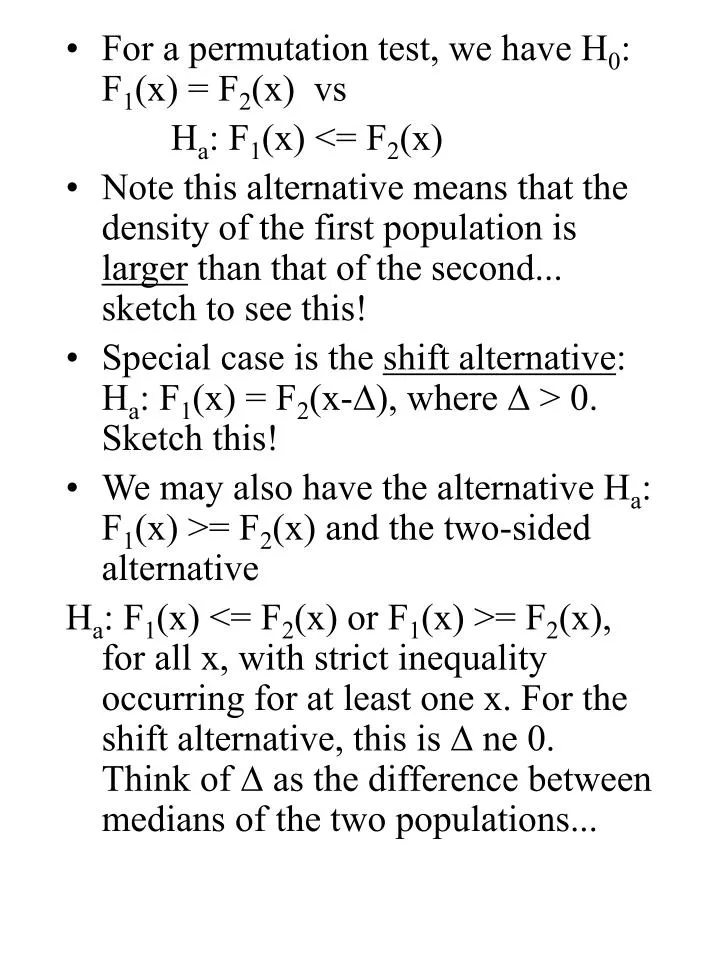
For a permutation test, we have H0: F1(x) = F2(x) vs Ha: F1(x) <= F2(x) • Note this alternative means that the density of the first population is larger than that of the second... sketch to see this! • Special case is the shift alternative: Ha: F1(x) = F2(x-D), where D > 0. Sketch this! • We may also have the alternative Ha: F1(x) >= F2(x) and the two-sided alternative Ha: F1(x) <= F2(x) or F1(x) >= F2(x), for all x, with strict inequality occurring for at least one x. For the shift alternative, this is D ne 0. Think of D as the difference between medians of the two populations...
Permutation tests may also be performed on other statistics besides the mean – of course, if population(s) are normal then mean are probably best – the textbook mentions ones based on the median and the trimmed mean. This gives permutation tests much flexibility ... • Note in Table 2.2.1 that changing the max. value has no effect on the medians but could impact the mean • p-values obtained from permutation distributions of test statistics are exact in the sense that they are not dependent upon unverified assumptions about the underlying population distribution ... • Approximate p-values may be obtained from random sampling of permutations and for large number of random samples, the error can be quite small – see bottom of page 32 for margin of error...
Permutation tests • We may also get approximate p-values by randomly sampling the permutations, instead of trying to write them all down. This is useful when m+n is large… • Do as before: • assign experimental units to the two groups at random and compute the difference between the means of the two groups, Dobs . There are m units assigned to group1 and n units to group2 (m+n total units). • randomly "sample" all the m+n observations so there are m in group1 and n in group2. • compute the difference between the means of the two groups of the "sampled" vector, D. • repeat this procedure a large number of times (1000 or larger). For an upper-tailed test, calculate the empirical p-value: # of times D>= Dobs / 1000 • make your decision about rejecting the null hypothesis based on this empirical p. • this empirical p-value is approximately normal with mean = true p and standard deviation = sqrt(p(1-p)/R) where R=# of randomly sampled permutations (1000 above) • Do example 2.3.1 on page 33 - use various test statistics with R.