Download
1 / 38
380 likes | 594 Views
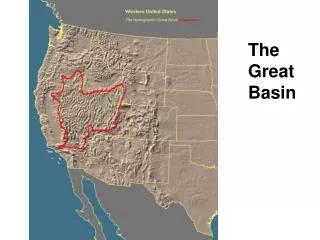
Great Basin Ozone Problem. Measurements indicate high ozone concentrations in the Great Basin. Back trajectory analysis and satellite remote sensing will be used to shed light on the causes. Great Basin National Park: 39.005 N 114.216 W. South Fork Recreation Area: 40.677 N 115.745 W. .

E N D
Great Basin Ozone Problem Measurements indicate high ozone concentrations in the Great Basin. Back trajectory analysis and satellite remote sensing will be used to shed light on the causes. Great Basin National Park: 39.005 N 114.216 W. South Fork Recreation Area: 40.677 N 115.745 W.
Ground Based Ozone Measurements at Two Remote Sites in Nevada
Ozone Time Series July – August 2011 July 22, 10 a.m. Aug 31 July 1
Back Trajectory Analysis for 22 July 2011 The ozone peak on this day at the Great Basin National Park is likely due to the air earlier passing over Las Vegas Nevada. It is likely that the green trajectory extends to Los Angeles as well. The air at the South Fork Recreation Area arrives from the north and west, and travels for awhile near the I80 corridor.
Valmy Power Plant may be the source of NOx for the South Fork Recreation Area ozone. From www.nvenergy.com
2005 Average July Tropospheric Ozone From NASA: http://acd-ext.gsfc.nasa.gov/Data_services/cloud_slice/#nd
2006 Average July Tropospheric Ozone From NASA: http://acd-ext.gsfc.nasa.gov/Data_services/cloud_slice/#nd
2007 Average July Tropospheric Ozone From NASA: http://acd-ext.gsfc.nasa.gov/Data_services/cloud_slice/#nd
2008 Average July Tropospheric Ozone From NASA: http://acd-ext.gsfc.nasa.gov/Data_services/cloud_slice/#nd
2009 Average July Tropospheric Ozone From NASA: http://acd-ext.gsfc.nasa.gov/Data_services/cloud_slice/#nd
2010 Average July Tropospheric Ozone From NASA: http://acd-ext.gsfc.nasa.gov/Data_services/cloud_slice/#nd
2011 Average July Tropospheric Ozone From NASA: http://acd-ext.gsfc.nasa.gov/Data_services/cloud_slice/#nd
Are we seeing a trend to higher global concentrations of ozone? Ozone is a very reactive, short lived gas. Ozone precursors include products of anthropogenic pollution and biomass burning.
Long Term Trend of Ozone At Mauna Loa Observatory High in the Hawaiian Islands. http://www.esrl.noaa.gov/gmd/dv/iadv/index.php?code=mlo
MODIS Aerosol Optical Depth Averaged For July 2005 - 2011 Diagnosis 2008 as a ‘fire year’ in Northern CA and NV. Great Basin values are likely biasedhigh due to surface brightness and algorithm assumptions (dark target retrieval).
Recall the standard ‘Dark Target’ method for obtaining surface reflectivity and AOD.
Review: MODIS ‘Dark Target’ Aerosol Retrievals Over Land Algorithm
660nm Scatterplot 470nm Scatterplot How does the surface reflectance model perform? (Andrew Joros results for the Great Basin)8 July 2011 – Dry Regime Y=.25x Y=. 5x 470 nm has lower reflectivity than 660 nm. Model and measurements match at only a few points. Green shaded region used in the ‘safe’ part of the ‘Dark Target’ algorithm. Red shaded region used for the alternate ‘Dark Target’ algorithm (note model disagreement).
660nm Scatterplot 470nm Scatterplot How does the surface reflectance model perform? (Andrew Joros results for the Great Basin)8 July 2011 – Dry Regime PROPOSE Y=x -1/8 when x > 0.25 PROPOSE Y=x/2 – 1/16 when x > 0.25 Y=x/2 Y=x/4 The black curve fits the lowest surface reflectance values much better for 2130 nm reflectancelarger than 0.25, likely representing desert surfaces rather than vegetated surfaces.
Pacific Decadal Oscillation: Link with Western US Meteorology and Pollution Transport? http://www.climate4you.com/SeaTemperatures.htm
PDO Index Time Series From http://www.climate4you.com/SeaTemperatures.htm