Download
1 / 65
650 likes | 782 Views
A n Objective Nowcasting Tool that Optimizes the Impact of Frequent Observations in Short-Range Forecasts a.k.a. “Stopping Short-Range Gap-osis”. Ralph Petersen 1 , Robert M Aune 2

E N D
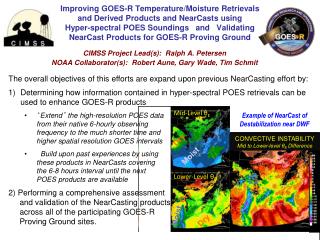
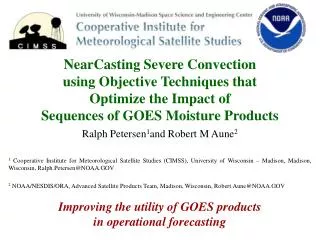
An Objective Nowcasting Tool that Optimizes the Impact of Frequent Observations in Short-Range Forecastsa.k.a. “Stopping Short-Range Gap-osis” Ralph Petersen1, Robert M Aune2 1 Cooperative Institute for Meteorological Satellite Studies (CIMSS), University of Wisconsin – Madison, Madison, Wisconsin, Ralph.Petersen@NOAA.GOV 2 NOAA/NESDIS/ORA, Advanced Satellite Products Team, Madison, Wisconsin, Robert.Aune@NOAA.GOV
Presentation OutlineBasic Mantra: Good data should be believed, used and re-used Focus on 3-6 hour forecast time frame Expand Forecaster’s tools Compliment and Update conventional NWP guidance Address the problem of Detecting and Forecasting the Dynamical and Thermodynamical Forces which: Create the pre-convective environment and Help trigger convective initiation Develop techniques to Expand the utility of Existing and Future Satellite Products Go beyond considering data useful only as observations Apply the techniaues Over Land Combine satellite data with other data in daily forecasting Maximize benefits of both
A basic premise - Any Nowcasting Model Should: Be used to update/enhance other numerical guidance: Be Fast Be run frequently Not needed to be constrained by longer-range NWP ‘computational stability’ issues Use all available data: “Draw closely” to good data Important for anticipating rapidly developing weather events: “Perishable” guidance products – rapid delivery Run Locally? – Few resources beyond comms, users easily trained We will focus on the “pre-storm environment” Increase Lead Time / POD and Reduce FAR Goals: - Increase the length of time that forecasters can make good use of quality observations (vs. NWP output) for their short range forecasts - Provide objective tools to help them do this
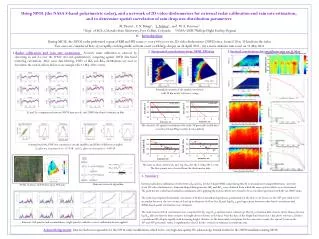
Making GOES Sounder Derived Product Images (DPI) more useful to forecasters To increase usefulness, rather than viewing sets of individual profiles, GOES Sounder products are being made available to forecasters as images Products include: - Total Precipitable Water (TPW) - 3-layers PW - Stability Indices, . . . DPIs + Speed comprehension of information in GOES soundings, and + Improve upon Model First Guess, but - - - - - - - - - - - - - - - - - - - - - - - - - - - - - - - - - - Only used as observations, and - Have no predictive component - Data not used in any NWS NWP models GOES 900-700 hPa Precipitable Water - 20 July 2005
Case of convection on 20 July 2005 which was initially moved over Central Wisconsin, Decayed and then Redeveloping past Chicago 1545 UTC 1715 UTC 1915 UTC Why did initial convection decay and why did it reform where it did?
0700 UTC Lower-tropospheric GOES Sounder Derived Product Imagery (DPI) 3 layers of Precipitable Water Sfc-900 hPa 900-700 hPa 700-300 hPa 1000 UTC Moisture Maximum 1300 UTC However, after initial storm has developed, cirrus blow-off masks lower-level moisture maximum in subsequent IR satellite observations Small cumulus developing in boundary layer later in morning also mask retrievals in second area. 1800 UTC GOES 900-700 hPa Precipitable Water - 20 July 2005
0700 UTC Mid-tropospheric GOES Sounder Derived Product Imagery (DPI) 3 layers of Precipitable Water Sfc-900 hPa 900-700 hPa 700-300 hPa 1000 UTC Maximum Dryness 1300 UTC Over time, cirrus blow-off also masks the presence of an extended area of mid-level dryness. (Differential motion of lower-tropospheric moisture under upper-tropospheric dryness creates convective instability) 1800 UTC GOES 700-300 hPa Precipitable Water - 20 July 2005
Two basic questions: 1 - Can we retain the satellite observations that were ‘lost’ after the cirrus shield appeared following the initial storm development? 2 - Does the underlying premise of data assimilation (that data should make small changes to an already good model) hold for nowcasting, where small-scale data extremes observed by various different observing systems can make the difference between a good and bad forecast?
For Nowcasting - Have we forgotten the Golden Rule of Forecasting? Always remember to look out of the window (or at satellite imagery) What do you see? - Clouds (or water vapor features) What are they doing? - Moving as ‘entities’ from one place to another The fundamental question to be addressed by this effort is: For Nowcasting, are there advantages in exchanging the non-linear advection terms in ‘classical’ grid-point models (which ‘recreate’ clouds as they move from grid point to grid point) with simpler LaGrangian schemes that can be used to update traditional NWP guidance bypredicting the movement of parcels that are frequently updated and initialized at observation points.
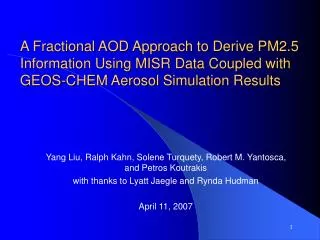
Motivation for a LaGrangian Nowcast approach? LaGrangian Trajectories Clearly show Development of Interplay between Dry Line from West and Moist Gulf Flow from South Sample LaGrangian Diagnostic Study of development of Pre-Convective Environment using 3-hourly Radiosonde Data From SESAME From Kocin et al., 1986. • Forward Trajectories • Backward Trajectories LaGrangian Techniques formulations based on Greenspan’s Discrete Model Theory (1972,73)
What are the benefits of a LaGrangian (‘Parcel’) Nowcasting Model? - It is fast (15 min t) and needs minimal computing resources - Can be used to ‘update’ other NWP guidance or ‘stand-alone’ DATA DRIVEN - Data can be used directly without ‘analysis smoothing’ – Retains maxima, minima and extreme gradients - Can combine Wind / Moisture observations from two sources - Spatial resolution adjusts to available data density and dynamics - GOES sounder products can be projected forward at fullresolution – even as they move into ‘data void’ cloudy areas - Use all data at time observed– not binned and averaged -Parcels from successive nowcasts can be tracked, aged and combined for output - Use best aspects of all available data sets e.g., Cloud Drift winds can be combined with surface obs cloud heights to create a ‘partly cloudy’ parcel with good height and good motion e.g., Wind Profiler / Aircraft data can be projected forward with accelerations
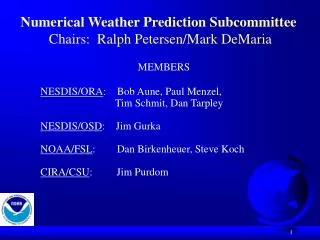
Analytical tests simulating Dynamics of an Idealized Jet Streak Fully balanced parcels enter Jet Streak from west with various balanced flow speeds, Jet Streak magnitudes, Sizes and Motions.
Analytical tests simulating Dynamics of an Idealized Jet Streak Divergence/Convergence is not divided into four symmetrical quadrants. Divergence on the cyclonic side is offset slight ahead and left of the Geostrophic max and extends well ahead of the core on the anticyclonic side. Divergence fields are dominated by cross-stream flow components. Convergence in anticyclonic exit region aloft corresponds with “Dry Slots’ in WV imagery. Strong Divergence/Convergence transition ahead in area of (CAT,Gravity Waves)
What have we done to date? 1 - Document the approach 2 - Perform analytical accuracy and performance tests 3 – Developing a Prototype Objective LaGrangian Nowcasting Model Initial development focusing on the optimal approaches for providing updates of existing mesoscale model outputs in the free-atmosphere The objective of these tests is to provide forecasters 3 to 6 hour forecasts of the DPI fields updated every hour Combines strengths of Short-Range NWP with strength of Satellites - Uses winds from RUC-II analyses + RUC-II geopotential anal/fcsts - Matches these data with GOES Sounder (DPI) Water Vapor Data GOES Sounder profiles not currently used in RUC over land - Projects the data matches forward in time (at 15 minute intervals) Additional observations can be included as they arrive (Satellite updates every 30-60 minutes possible)
Returning to 20 July 2005 case Question: Can GOES Sounder Derived Product Imagery (DPI) be projected forward in time to provide forecasters more information about second storm development south of Chicago at ~ 1800 UTC? 0700 UTC 1000 UTC Moisture Maximum 1300 UTC However, after initial storm has developed, cirrus blow-off masks lower-level moisture maximum in subsequent IR satellite observations Small cumulus developing in boundary layer also mask retrievals in second moist area. 1800 UTC GOES 900-700 hPa Precipitable Water - 20 July 2005
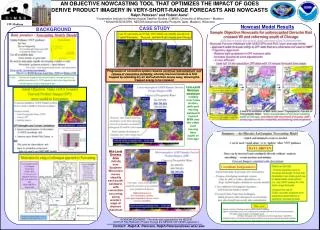
White =Cloudy Blue = Moisture Maximum 20 July 2005 Case StudyNowcasting the Lower-Tropospheric Moisture Source1200 UTC data projected forward to 1800 UTC 0.00 Hr LaGrangian Nowcast 900-700 GOES Precipitable Water 0-10 mm – Red,10-20 mm – Green>20 mm - Blue
0.00 Hr LaGrangian Nowcast 900-700 GOES Precipitable Water 0-10 mm – Red,10-20 mm – Green>20 mm - Blue
0.50 Hr LaGrangian Nowcast 900-700 GOES Precipitable Water 0-10 mm – Red,10-20 mm – Green>20 mm - Blue
1.00 Hr LaGrangian Nowcast 900-700 GOES Precipitable Water 0-10 mm – Red,10-20 mm – Green>20 mm - Blue
1.50 Hr LaGrangian Nowcast 900-700 GOES Precipitable Water 0-10 mm – Red,10-20 mm – Green>20 mm - Blue
2.00 Hr LaGrangian Nowcast 900-700 GOES Precipitable Water 0-10 mm – Red,10-20 mm – Green>20 mm - Blue
2.50 Hr LaGrangian Nowcast 900-700 GOES Precipitable Water 0-10 mm – Red,10-20 mm – Green>20 mm - Blue
3.00 Hr LaGrangian Nowcast 900-700 GOES Precipitable Water 0-10 mm – Red,10-20 mm – Green>20 mm - Blue
3.50 Hr LaGrangian Nowcast 900-700 GOES Precipitable Water 0-10 mm – Red,10-20 mm – Green>20 mm - Blue
4.00 Hr LaGrangian Nowcast 900-700 GOES Precipitable Water 0-10 mm – Red,10-20 mm – Green>20 mm - Blue
4.50 Hr LaGrangian Nowcast 900-700 GOES Precipitable Water 0-10 mm – Red,10-20 mm – Green>20 mm - Blue
5.00 Hr LaGrangian Nowcast 900-700 GOES Precipitable Water 0-10 mm – Red,10-20 mm – Green>20 mm - Blue
5.50 Hr LaGrangian Nowcast 900-700 GOES Precipitable Water 0-10 mm – Red,10-20 mm – Green>20 mm - Blue
6.00 Hr LaGrangian Nowcast 900-700 GOES Precipitable Water 0-10 mm – Red,10-20 mm – Green>20 mm - Blue
Important Lower-Level Moisture Information about Storm Formation Obscured by Clouds from Storm in Observations 6.00 Hr LaGrangian Nowcast 900-700 GOES Precipitable Water 0-10 mm – Red,10-20 mm – Green>20 mm - Blue
White =Cloudy Purple=MaximumDryness 20 July 2005 Case StudyNowcasting the Middle-Tropospheric Dryness1200 UTC data projected forward to 1800 UTC 0.00 Hr LaGrangian Nowcast 700-300 GOES Precipitable Water 0-5 mm – Purple, 5-10 mm – Black >10 mm – Light Blue
0.00 Hr LaGrangian Nowcast 700-300 GOES Precipitable Water 0-5 mm – Purple, 5-10 mm – Black >10 mm – Light Blue
0.50 Hr LaGrangian Nowcast 700-300 GOES Precipitable Water 0-5 mm – Purple, 5-10 mm – Black >10 mm – Light Blue
1.00 Hr LaGrangian Nowcast 700-300 GOES Precipitable Water 0-5 mm – Purple, 5-10 mm – Black >10 mm – Light Blue
1.50 Hr LaGrangian Nowcast 700-300 GOES Precipitable Water 0-5 mm – Purple, 5-10 mm – Black >10 mm – Light Blue
2.00 Hr LaGrangian Nowcast 700-300 GOES Precipitable Water 0-5 mm – Purple, 5-10 mm – Black >10 mm – Light Blue
2.50 Hr LaGrangian Nowcast 700-300 GOES Precipitable Water 0-5 mm – Purple, 5-10 mm – Black >10 mm – Light Blue
3.00 Hr LaGrangian Nowcast 700-300 GOES Precipitable Water 0-5 mm – Purple, 5-10 mm – Black >10 mm – Light Blue
3.50 Hr LaGrangian Nowcast 700-300 GOES Precipitable Water 0-5 mm – Purple, 5-10 mm – Black >10 mm – Light Blue
4.00 Hr LaGrangian Nowcast 700-300 GOES Precipitable Water 0-5 mm – Purple, 5-10 mm – Black >10 mm – Light Blue
4.50 Hr LaGrangian Nowcast 700-300 GOES Precipitable Water 0-5 mm – Purple, 5-10 mm – Black >10 mm – Light Blue
5.00 Hr LaGrangian Nowcast 700-300 GOES Precipitable Water 0-5 mm – Purple, 5-10 mm – Black >10 mm – Light Blue
5.50 Hr LaGrangian Nowcast 700-300 GOES Precipitable Water 0-5 mm – Purple, 5-10 mm – Black >10 mm – Light Blue
6.00 Hr LaGrangian Nowcast 700-300 GOES Precipitable Water 0-5 mm – Purple, 5-10 mm – Black >10 mm – Light Blue
Important Upper-Level Dryness Information about Storm Formation Obscured by Clouds from Storm in Observations 6.00 Hr LaGrangian Nowcast 700-300 GOES Precipitable Water 0-5 mm – Purple, 5-10 mm – Black >10 mm – Light Blue
Sample Nowcasts from 20 July 2005 Case StudyCombining Lower-Level Moisture and Middle-Tropospheric Dryness to Derive Convective DestabilizationOverlays of 1200 UTC data projected forward to 1800 UTC 0.00 Hr LaGrangian Nowcast 900-700 GOES Lower-Tropospheric Moisture - >20 mm PW - Blue 700-300 GOES Upper-Tropospheric Dryness - 0-5 mm PW– Purple
0.00 Hr LaGrangian Nowcast 900-700 GOES Lower-Tropospheric Moisture - >20 mm PW - Blue 700-300 GOES Upper-Tropospheric Dryness - 0-5 mm PW– Purple
0.00 Hr LaGrangian Nowcast 900-700 GOES Lower-Tropospheric Moisture - >20 mm PW - Blue 700-300 GOES Upper-Tropospheric Dryness - 0-5 mm PW– Purple
1.00 Hr LaGrangian Nowcast 900-700 GOES Lower-Tropospheric Moisture - >20 mm PW - Blue 700-300 GOES Upper-Tropospheric Dryness - 0-5 mm PW– Purple
1.00 Hr LaGrangian Nowcast 900-700 GOES Lower-Tropospheric Moisture - >20 mm PW - Blue 700-300 GOES Upper-Tropospheric Dryness - 0-5 mm PW– Purple