Download
1 / 12
120 likes | 246 Views
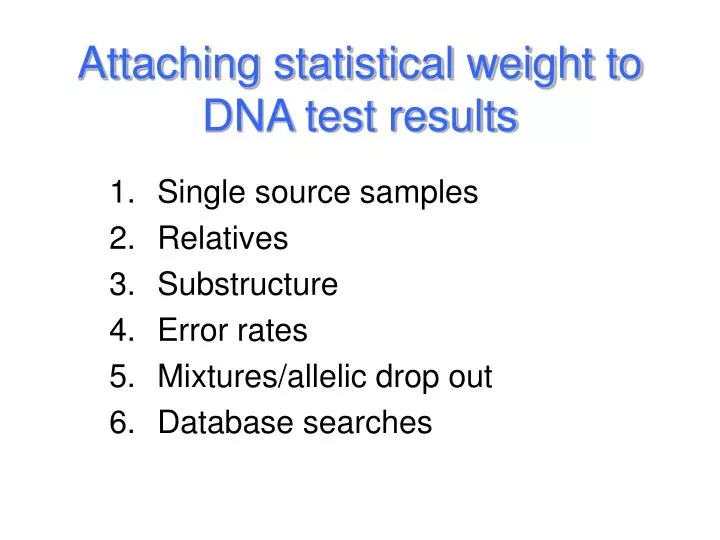
Attaching statistical weight to DNA test results. Single source samples Relatives Substructure Error rates Mixtures/allelic drop out Database searches. Single Source Samples. If the defendant is not the source of the evidence DNA then the observed match is a coincidence.

E N D
Attaching statistical weight to DNA test results Single source samples Relatives Substructure Error rates Mixtures/allelic drop out Database searches
Single Source Samples • If the defendant is not the source of the evidence DNA then the observed match is a coincidence. • Therefore a relevant weight for the evidence is the probability of a randomly chosen person having a matching DNA profile to the evidence
Single Source: population genetics • For each locus the frequency of each genotype if computed from the Hardy-Weinberg law • Homozygotes: AiAi • Let freq(Ai) be pi then the HW genotype frequency is pi2 • Heterozygotes: AiAj • 2pipj
Relatives • Relatives are more likely to share alleles in common that they have inherited from their common ancestor. • Full Sibs: AiAi:(1+2pi+pi2)/4AiAj:(1+pi+pj+2pipj)/4 • Example: p14(D3) = 0.14HW frequency= 0.02Pr(matching sibling) = 0.32
Population Substructure Source population ps Populations separated t generations pm p1 p2 p3 p4 Source population is very large Each subpopulation has N individuals, and are isolated from each other Allele frequencies in each subpopulation become different over time
Effects of substructure • In the pooled subpopulations genotype frequencies depart from the Hardy-Weinberg expectations • Freq(AiAi) = pi2 +qpi(1-pi) • Freq(AiAj) = (1-q)2pi(1-pj) • The NRCII recommendation is to correct homozygote frequencies using the first formula
Conditional Probabilities • If we assume defendant and perpetrator are likely to be form the same subpopulation different calculations are relevant
Error Rates • Use likelihood ratios, en- false negative, ep false positive • Prosecution hypothesis: perpetrator and suspect the same person, no false negative-{1´(1-en)} • Defense hypothesis: suspect matches evidence coincidentally and no false negative, or suspect does not match evidence and a false positive- {RMP´(1-en) + (1-RMP)´ep}. • Suppose, RMP=10-15, en=10-3, ep=10-4, then the LR= 0.999/[10-15´0.999+(1-10-15)10-4] @ 1/ep
Mixtures/Drop out • Combined probability of inclusion, add up all possible contributing genotype • Evidence: a, b, c • Possible genotypes: aa, ab, ac, bb, bc, cc • This method does not require that you make any assumption about the number of contributors, or major/minor donors – but can not take into account drop out easily
Mixtures/Likelihood ratios • This requires that the number of contributors be specified • These methods can take into account allelic drop out – removing these loci is not a sufficient solution • Calculations can get very complicated • Popstats has software to do this although it does not account for drop out.
State Match Report Matches at both high and moderate stringency Analyst eliminates this match after an evaluation that can’t be written into the computer program or the lab’s SOP.
Methods for computing statistics • NRC I – use one set of loci for the search and a second set to confirm • NRC II – multiply the RMP by the size of the database • Bayesian – gives weight to the exclusions, number is close to the RMP • RMP only – based on illogic that retest of known resets case to probable cause