Download
1 / 18
180 likes | 272 Views
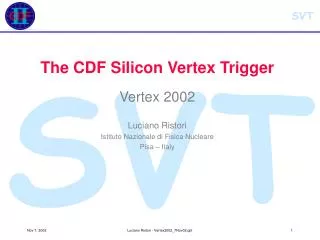
Using the Trigger Test Stand at CDF for Benchmarking CPU (and eventually GPU) Performance. Wesley Ketchum (University of Chicago) 10.27.2010. Outline. Overview of previous work done for calculations done by a CPU Description of test stand and components in our setup

E N D
Using the Trigger Test Stand at CDF for Benchmarking CPU (and eventually GPU) Performance Wesley Ketchum (University of Chicago) 10.27.2010
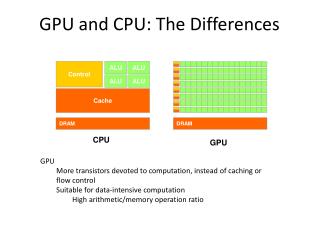
Outline • Overview of previous work done for calculations done by a CPU • Description of test stand and components in our setup • Latency measurements for a track fitting algorithm measured by PULSARS and internal timing in CPU • Preliminary studies on latency measurements for calculations done by GPU • Comparisons with CPU • Future work
Goals of Previous Work done with CPU • Goals: • Restore CDF L2 test stand to working state • Configure pulsar boards to transmit and receive test patterns • Run simplified linear track fitting algorithm on CPU • Input read in from test patterns sent via S-LINK • Measure latency using internal CPU timing functions and PULSAR boards • Work served as required experimental project for Ho Ling Li (now 2nd year UChicago grad student) • Help from Jian Tang (UChicago), Pierluigi Catastini and Ted Liu (FNAL)
Flow Chart of Test Stand Setup S-LINK Tx AUX Card GPU Memory FILAR S-LINK Rx CPU SOLAR
Physical Test Stand Setup • Pulsars housed in VME crate • Tools exist to communicate/load code into crate • That code controls run configurations • PC is a retired L2 Linux Machine • Equipped with FILAR and SOLAR cards to receive/send S-LINK packets • “Runs” occur using CDF RunControl DAQ software • Level 1 Accept prompts sending of loaded test patterns
The PULSARS S-LINK Tx AUX Card S-LINK Rx • PULSARS • PULSer And Recorder • Highly configurable • Special purpose firmware loaded into FPGAs, defining board function • Used for variety of purposes in L2 trigger at CDF • S-LINK Tx • Test patterns loaded into board, send on L1A • AUX card • Attached to back of Tx • Sends out multiple copies of S-LINK packets • S-LINK Rx • Fitted with 4 mezzanine cards that read in S-LINK packets • Measure time (to 100 ns) after L1A a packet was received S-LINK Card
FILAR and SOLAR Cards PC FILAR • FILAR • Four Input Links for Atlas Readout • Accepts S-LINK packets, stored into PC memory on arrival • SOLAR • Single Output Link for Atlas Readout • Sends out specified memory in S-LINK format • FILAR and SOLAR cards connect to PC via PCI-X slots SOLAR FILAR
PC and Track Fitting Algorithm • The PC • 2.4 GHz processor speed • Pre-developed tools from L2 testing for… • Reading in from FILAR • Sending out along SOLAR • Internal timing • Track Fitting Procedure • Copy in “track” data from S-LINK package • Retrieve constant set used for evaluating fit parameters • Run (linear) track fitting algorithm to calculate fit parameters • Store calculated parameters (and internal timing info) to be sent on SOLAR PC FILAR SOLAR
Latency Measurement Strategy • From PULSARS • Record arrival time of packet coming straight from AUX Card • Record arrival time of packet coming from PC • Checking fit parameter evaluation has been done • Difference is time for PC evaluation (neglecting extra cable time, which is small) • From PC • Place time stamps around running of algorithm • Output difference along S-LINK • Determine latency for various iterations of fitting algorithm (only step 3 from previous slide) • Model as TPC = n Talg + TO
Sample PULSAR Latency Measurements Track fitting algorithm not run (read-in then read-out). Track fitting algorithm run once.
Algorithm Times as Measured in PULSAR and PC Linear Scale Log Scale
Internal Timing Measurements • Having validated CPU internal timing, place time stamps around various steps of track fitting procedure Fitting algorithm run only once. Fitting algorithm run 100 times.
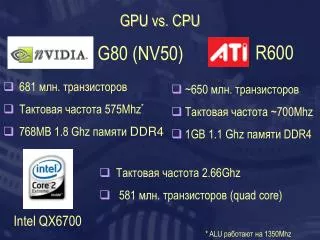
New Work with GPU • Recently got new machine capable of housing a GPU • NVIDIA GTX 285 (for computations) • eVGA e-GeForce 9500 GT (for display) • Intel Core i7 Processor, 2.80 GHz • 6 GB RAM • 2 PCIe slots (GPUs) and 2 PCI-X slots (FILAR and SOLAR) • Use CUDA tools/framework to run same linear track fitting algorithm for multiple tracks in a GPU • Focus so far with getting things running with same simple code • Plenty of optimization to go with just simple code, even more when we complicate the fitting procedure
Conclusion and Outlook • Developed setup at test stand to measure latency of track fitting algorithm in CPU • Can include full readout times via timing information in PULSARS • Have new machine capable of housing GPU, FILAR, and SOLAR cards • Makes possible doing latency measurements for calculations done in GPU • Can compare with similar calculations in CPU • Near Future • Setup new machine at test stand in place of old L2 PC and provide performance benchmark
Trigger Test stand at CDF GPU mem Slink to PCI SVT TX CPU PCI to Slink Cluster SVT Rx SLINK Merger SLINK Electron
Flow Chart of Test Stand Setup S-LINK Tx AUX Card GPU Memory FILAR CPU S-LINK Rx SOLAR