Download
1 / 1
10 likes | 118 Views
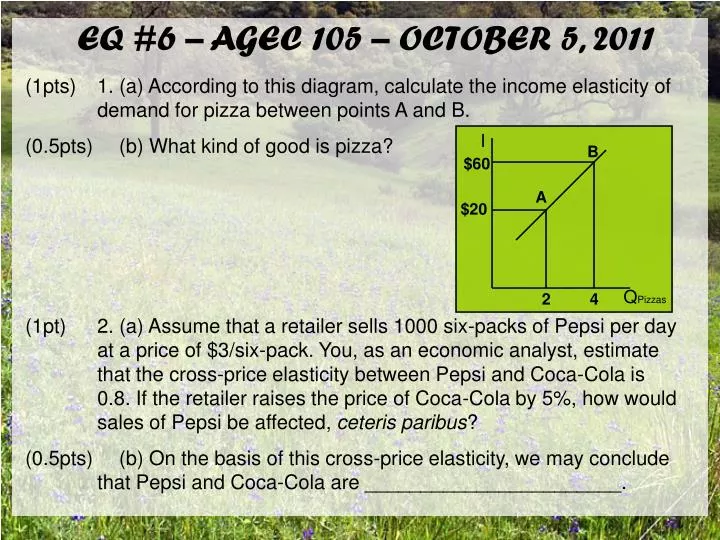
I. B. $60. A. $20. Q Pizzas. 2. 4. EQ #6 – AGEC 105 – OCTOBER 5, 2011. (1pts) 1. (a) According to this diagram, calculate the income elasticity of demand for pizza between points A and B. (0.5pts) (b) What kind of good is pizza?

E N D
I B $60 A $20 QPizzas 2 4 EQ #6 – AGEC 105 – OCTOBER 5, 2011 (1pts) 1. (a) According to this diagram, calculate the income elasticity of demand for pizza between points A and B. (0.5pts) (b) What kind of good is pizza? (1pt) 2. (a) Assume that a retailer sells 1000 six-packs of Pepsi per day at a price of $3/six-pack. You, as an economic analyst, estimate that the cross-price elasticity between Pepsi and Coca-Cola is 0.8. If the retailer raises the price of Coca-Cola by 5%, how would sales of Pepsi be affected, ceteris paribus? (0.5pts) (b) On the basis of this cross-price elasticity, we may conclude that Pepsi and Coca-Cola are _______________________.