Download
1 / 29
360 likes | 770 Views
Digital Holographic Microscopy for Measurement of Cellular Refractive Indices. Robert Thomen Creighton University Master’s Thesis Defense 4-27-11. Motivation and Purpose. What we want: the refractive index of living cells, particularly bone cells!

E N D
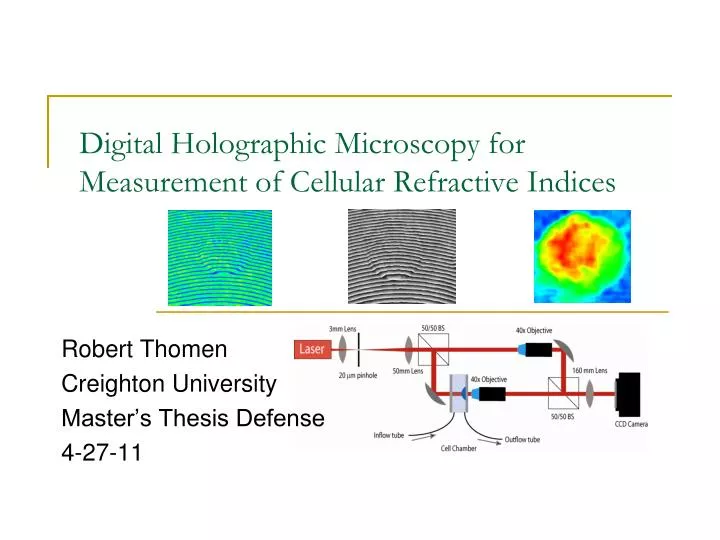
Digital Holographic Microscopy for Measurement of Cellular Refractive Indices Robert Thomen Creighton University Master’s Thesis Defense 4-27-11
Motivation and Purpose • What we want: the refractive index of living cells, particularly bone cells! • Why we want it: the refractive index is required to accurately determine pressure measurements in the optical stretcher.
What is Holography? • Records 3-D images by taking advantage of the wave nature of light • Can also be used to record differences in optical path length through transparent objects d
Design of the Microscope y If we find Δφ, we can find nc and h. x …so, how do we find Δφ?
Flowchart for Procedure Cell Height 1. Calculate phase using Hilbert Transform 2. Unwrap phase using Goldstein’s Algorithm 3. Calculate cell height and index for every pixel 4. Profit Cell Index
1. Calculating the phase Any analytic signal can be written in the form: where the imaginary part is the Hilbert Transform of the real part. The Hilbert Transform is defined The phase of our signal at every point is then So what does the Hilbert transform actually do?...
What exactly does the HT do? • The Hilbert Transform has the effect of shifting each frequency component in a signal by π/2 • We can make this manipulation in frequency space!
Hilbert and Fourier are close relatives Let φ=wt • The Hilbert Transform manipulates the phase of the signal’s frequency space The Fourier Transform
Two-Dimensional Phases The 2D Fourier Transform DC centered Fringe Frequencies We have now found φ!.....or have we?....
2. Unwrapping the Phase • By nature of the arctan function, our phase map is “wrapped” We must then unwrap the phase
The Effects of Noisy Data Digital noise can cause miscalculation of the phase in The unwrapping algorithm. 4π 6π 4π 2π 2π How can we deal with noisy data?
Filtering processes to Remove Noise Several filtering techniques have been employed in our code • Median Filtering • For each pixel, a surrounding box of pixels is selected and the median pixel intensity of these is substituted • Fourier Filtering • By taking the Fourier transform of an image, we can selectively remove certain frequency information. But filtering changes our data!
Residues and Branch Cuts • Problematic pixels can be recognized as residues • Residues occur at singularities in otherwise entirely analytic functions • Residues can be calculated for a contour around each pixel • Residues can be connected by branch cuts which disallow unwrapping progression through certain parts of the phase map We have implemented Goldstein’s Algorithm to make these branch cuts.
This can be done in LabVIEW Capture image Take the Hilbert Transform of that image Inverse tangent to find phase What do we get when we do this?...
Labview Program We now have the phase image!
3. Taking the Data • We require 3 images • 1. Background • Move cell into the frame • 2. Cell in media of index n • Add media of higher index • Must monitor phase shift • 3. Cell in media of index n+δ ΦC0 ΦN0 ΦC+ This procedure was developed by Rappaz et al. Opt Express 13, 9361 (2005)
Verifying the integrity of our results Are the numbers accurate? Do we take good data? Does our program work? • We have constructed a program to synthesize perfect data to test our algorithms Examples of a Gaussian-shaped cell of index 1.38 and peak height 10,000nm Now we can address the effects of filters…
Effects of Filtering on Ideal Data So what are filters good for?...
Effects of Filters on Noisy Data n=1.38874+/-.002827 Even if filtering is necessary, the average index is preserved!
Single Cell Results (EMT6) nm nm radians Frame #
Refractive Index Data for EMT6 cells Average precision of .003 n633 = 1.384 ± 0.041 n735 = 1.387 ± 0.023 n812 = 1.375 ± 0.013 What is the characteristic Index of EMT6 cells?
Conclusions • DHM is operational and taking data • Image processing algorithm has been tested on synthesized data to verify the integrity of results • There seems to be a great deal of index variation from cell to cell (EMT6 cell data at 735nm) • Portable model has been developed • Soon to take data at 1064nm
Acknowledgments • Dr. Mike Nichols • Semere Woldemariam • NIH grant P20 RR016475 from the INBRE Program of the National Center for Research Resources. Questions…
Holography and Interferometry • Holography can display 3D images because it records not only the light’s intensity but also its phase We use this principle of holography to detect optical path length variations in transparent media. This difference in OPL is measured as a phase difference… Cell images from Tomographic Phase Microscopy, Michael S. Feld et al. September 2007 Nature Methods Vol. 4, No. 9.
Design and Construction • Mach-Zender Interferometer
Frequency Analysis • Simply get rid of negative frequencies using a Fourier transform! • This process will follow this procedure Recall f(t) is two dimensional… Let and
What good is phase? • We have phase data, but who cares about phase? • In order to get n and h, we have developed decoupling techniques
Acknowledgments • Dr. Mike Nichols • Semere Woldemariam • NIH grant P20 RR016475 from the INBRE Program of the National Center for Research Resources. Questions…