Download
1 / 19
190 likes | 304 Views
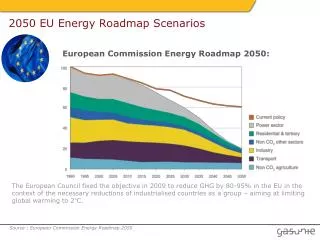
ROADMAP 2050. A practical guide to a prosperous, low-carbon Europe. ROADMAP 2050 PARTNERS. KEY STAKEHOLDERS WERE INVOLVED BY PROVIDING INPUT AND REVIEWING RESULTS. Core Working Group participants. Further outreach. Utilities. Plus 40 more companies, NGOs and research institutes.

E N D
ROADMAP 2050 A practical guide to a prosperous, low-carbon Europe
KEY STAKEHOLDERS WERE INVOLVED BY PROVIDING INPUT AND REVIEWING RESULTS Core Working Group participants Further outreach Utilities Plus 40 more companies, NGOs and research institutes Transmission System Operators Manufacturers Siemens NGOs WWF
THE DECARBONIZATION PATHWAYS ANALYSED ARE SUSTAINABLE, TECHNICALLY FEASIBLE, AND HAVE A POSITIVE IMPACT ON THE ECONOMY
AT LEAST 80% CO2 EMISSION REDUCTION 1 Based on the McKinsey Global GHG Cost Curve 2 Large efficiency improvements already included in the baseline 3 CCS applied to 50% of industry (cement, chemistry, iron and steel, petroleum and gas, not applied to other industries) SOURCE: McKinsey Global GHG Abatement Cost Curve; IEA WEO 2009; US EPA; EEA; Roadmap 2050 Technical Analysis
ELECTRICITY DEMAND 2050 (EU-27 + Norway & Switzerland)
THREE SPECIFIC PATHWAYS MODELED INCLUDING BOTH GENERATION AND GRID COSTS 40% RES 30% CCS 30% nuclear 60% RES 20% CCS 20% nuclear 80% RES 10% CCS 10% nuclear Energy production mix over the year, TWh per week
Pathways DR, % 0 0 20 0 20 0 20 CURTAILMENT IS KEPT LOW THROUGH GRID EXPANSION AND BACK-UP CAPACITY 2050, GW Transmission & generation capacity requirements RES curtail-ment1, % Transmission Back-up and balancing Baseline Requirements on top of the baseline 3 80% RES 10% CCS 10% nuclear 2 2 60% RES 20% CCS 20% nuclear 1 2 40% RES 30% CCS 30% nuclear 2 13