Download
1 / 20
200 likes | 331 Views
Morgan L. Silverman 1,3 , James Szykman 2 , James H. Crawford 3 , Christian Hogrefe 2 , Brian Eder 2 , Thomas Pierce 2 , S.T. Rao 4 , Todd Plessel 5 , Matt Freeman 5 , Jean Pierre Cammas 6 , and Andreas Volz-Thomas 7 1 Science Systems and Applications, Inc.

E N D
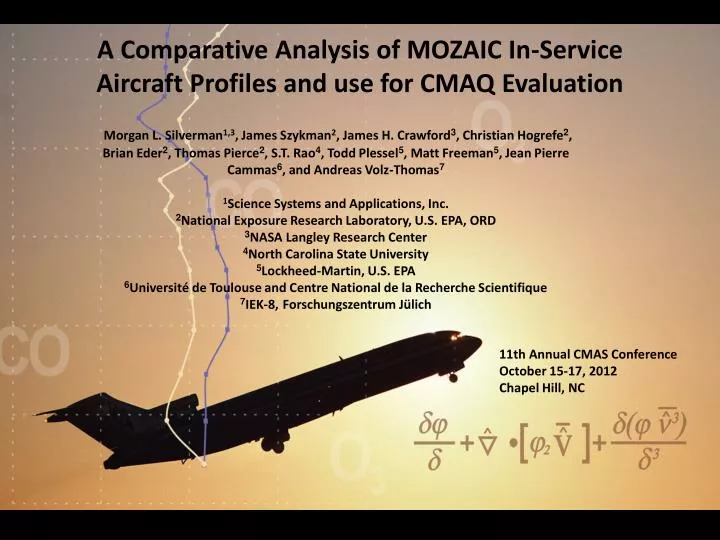
Morgan L. Silverman1,3, James Szykman2, James H. Crawford3, Christian Hogrefe2, Brian Eder2, Thomas Pierce2, S.T. Rao4, Todd Plessel5, Matt Freeman5, Jean Pierre Cammas6, and Andreas Volz-Thomas7 1Science Systems and Applications, Inc. 2National Exposure Research Laboratory, U.S. EPA, ORD 3NASA Langley Research Center 4North Carolina State University 5Lockheed-Martin, U.S. EPA 6Université de Toulouse and Centre National de la Recherche Scientifique 7IEK-8,ForschungszentrumJülich A Comparative Analysis of MOZAIC In-Service Aircraft Profiles and use for CMAQ Evaluation 11th Annual CMAS Conference October 15-17, 2012 Chapel Hill, NC
Observational Needs for Four-Dimensional Air Quality Characterization • Air quality models play an important role in the decision-making process for emission controls and definition of air quality standards. • Model evaluation is essential for model development and improvement. • Routine vertical profile data are needed to assess: • -Vertical mixing (Boundary Layer-Free Troposphere) • -Hemispheric transport • -Lightning generated NOx • -Stratospheric Intrusion (Scheffe et al., 2009)
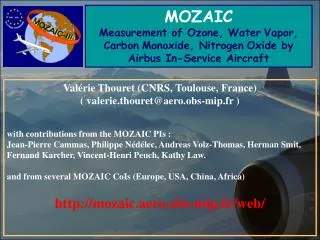
MOZAIC, a European partnership between scientists, Airbus and commercial airlines began measuring ozone and water vapor from commercial aircraft in 1994. • The MOZAIC program flew 5 long-haul aircraft with trace gas and meteorological measurements of O3, CO, NOy, T, P, RH, wind speed and direction. • MOZAIC is now part of IAGOS (In-Service Aircraft for the Global Observing System), a new European initiative to measure tropospheric and lower stratospheric air quality and greenhouse gases with instruments based on commercial aircraft. • Goal of IAGOS: Over the next decade install monitoring equipment on 10-20 commercial aircraft, based around the world. North American Airports with available MOZAIC vertical profiles of trace gases
Motivation • The existing literature contains an extensive use of MOZAIC in-service aircraft profiles for UT/LS model evaluation and trends, but a limited use for regional model evaluation in the lower troposphere. • The success of the MOZAIC/IAGOS program provides a data set which fills a critical data gap for routine profile data (O3, CO, NOy, RH, T, P, wind speed and direction). EPA is using the data under the AQMEII project and internally for regional model evaluation. • Concerns have been raised about the representativeness of in-service aircraft trace gas profiles for background conditions Fischer et al., (2006).
Approach • Find a way to help characterize the representativeness of the MOZAIC in-service aircraft lower tropospheric profiles (< 6 km) in the urban corridors. • Most MOZAIC trace gas profiles (1994-2010) over the US only measure O3. MOZAIC added CO and NOy measurements in 2002; providing a set of O3, CO and NOy profiles which span from 2002-2005. • Use data from NOAA NEAQS-ITCT (2004) and NASA DISCOVER-AQ (2011) to compare with MOZAIC profiles.
Data Used for Comparative Analysis • The NOAA New England Air Quality Study Intercontinental Transport and Chemical Transformation program (NEAQS-ITCT 2004) conducted as part of the larger trans-Atlantic ICARTT study • July/August 2004 • O3, NOy (Ryerson) and CO (Holloway) measurements collected with the NOAA WP-3D • The NASA Deriving Information on Surface conditions from COlumn and VERtically resolved observations relevant to Air Quality (DISCOVER-AQ) • July 2011Baltimore-DC Metro Area • Focused on understanding the relationship between column observation and surface pollution. • O3, NOy (Weinheimer) and CO (Diskin) spirals collected with the NASA P-3B over 6 Maryland Department of the Environment Monitoring Sites.
MOZAIC O3 (left), NOy (right), and CO (bottom) Profiles Descending Flights for Eastern U.S. Airports (2003-2004 June-Sep) • Profiles from Newark JFK, Dulles, and Philadelphia combined. • Box-Whisker bars are 10th and 90th percentiles to remove extreme values. • In general, small variation between 25-to-75 percentiles, with the exception of ATL NOy profiles.
MOZAIC Profiles and NOAA WP-3D O3 (left), NOy (right), and CO (bottom) aircraft measurements • NOAA WP-3D measurements plotted are limited to the flight paths within a geographic domain from Boston to Washington DC. • WP-3D [O3] distributions higher than MOZAIC, best agreement with MOAZIAC mid-Atlantic Airports. • Median [NOy] distributions for WP-3D and EWR-JFK-IAD-PHL MOZAIC Flights differ by 2 ppb.
MOZAIC Profiles, NEAQS-ITCT, and DISCOVER-AQ O3 (left), NOy (right), and CO (bottom) NASA P-3B spirals (Baltimore 2011) • Difference between MOZAIC and NEAQS-ITCT and DISCOVER-AQ NOy distributions appear reasonable given 30-40% percent decrease in NOx point source emissions (NOx SIP Call and CAIR) and mobile source over the past decade (Gilliland et al., 2008 and Russell et at., 2012 ACPD).
MOZAIC Profiles and DISCOVER-AQ O3 (left), NOy (right), and CO (bottom) NASA P-3B spirals (Baltimore 2011) • Here we show a profile from the NASA P-3B descent into BWI Airport. • Coincident increases in NOy and CO concentrations below 1 km. NO2 provides upper bound on possible O3 titration by NO.
CMAQ Model ConfigurationUsed for AQMEII Base Run (US1-2006) Weather Research and Forecasting (WRF) Meteorology CMAQv4.7.1 w/ CB05 & AERO5 Modeling domain 12 km grid resolution 34-vertical layers up to 50 hPa 2005 U.S. National Emissions Inventory Emissions: year-specific updates to EGU, mobile and fire (SmartFIRE) Chemical boundary conditions specified by the Global and regional Earth-system Monitoring using Satellite and in-situ data (GEMS) MOZAIC observations regridded to CMAQ layers – Implemented within the EPA Remote Sensing Information Gateway for continued use with MOZAIC data
MOZAIC and CMAQ O3 (51) and CO (55) Profiles Summer 2006 (J,J,A) Descending Flights Philadelphia Airport (PHL) 35% 3pm, 53% 4pm • CMAQ [O3] distributions are low ~3-5 km as compared to MOZAIC and become higher than MOZAIC as the [CO] concentrations increase below 2 km. • CMAQ and MOZAIC [O3] distributions in the lowest few 100 meters agree well. • [CO] overestimated in CMAQ and greater variability in the BL versus MOZAIC [CO].
MOZAICand CMAQ O3 (52) and CO (50) Profiles Summer 2006 (J,J,A) Ascending Flights Philadelphia Airport (PHL) 38% 6pm, 43% 7pm • CMAQ [O3] distributions low ~3-5 km compared to MOZAIC, but to a lesser degree than descending flights. • CMAQ and MOZAIC [O3] distributions in the lowest 2 km agree well but a bit high closer to the surface. • CMAQ [CO] distributions better aligned with variability seen in MOZAIC [CO].
MOZAIC and CMAQ O3 (63) and CO (71) Profiles Summer 2006 (J,J,A) Descending Flights Hartsfield-Jackson Atlanta International Airport (ATL) 77% 2pm • CMAQ [O3] distributions are in agreement above 2 km as compared to MOZAIC but become significantly higher below this altitude. • CMAQ [CO] distributions follow the same pattern with higher variability in the model.
MOZAIC and CMAQ O3 (63) and CO (67) Profiles Summer 2006 (J,J,A) Ascending Flights Hartsfield-Jackson Atlanta International Airport (ATL) 71% 5pm • CMAQ [O3] distributions are low ~2-5 km as compared to MOZAIC and become higher than MOZAIC below 2 km with large differences below 1km. • CMAQ [CO] distributions are low ~2-5km and become higher lower in elevation.
Summary and Next Steps • MOZAIC/IAGOS In-Service Trace Gas profiles provide a high quality data set for use in regional CTM evaluation such as CMAQ. • MOZAIC profiles appear to provide valuable insight into the model performance given the agreement in distributions between MOZAIC, NEASQ-ITCT, and DISCOVER-AQ aircraft data. • Extreme values should be screened out and flight times (descent and ascent) should be accounted for in analysis. Extreme values are useful for event case studies. • Investigate use of the Aircraft Communications Addressing and Reporting System (ACARS) and the Aircraft Meteorological Data Relay (AMDAR) data set to characterize boundary layer changes in conjunction with MOZAIC descents and ascents.
Disclaimer: Although this work was reviewed by EPA and approved for presentation, it may not necessarily reflect official Agency policy.
Evaluation protocol: Remapping MOZAIC observations to CMAQ cell value • MOZAIC observation were regridded to CMAQ layers using CMAQ vertical grid description parameters NLAYS, VGTOP, VGLVLS (sigma pressures), etc. to compute the CMAQ levels in meters. • An inverse distance-weighted scheme is used for aggregating multiple MOZAIC observations within a single CMAQ grid cell. • Method implemented within the EPA Remote Sensing Information Gateway for continued use with MOZAIC data. CMAQ cell value = ( Mozaic value1 x 1/r12 ) + ( Mozaic value2 x 1/r22 ) + ... ( Mozaic valueN x 1/rN2 ) / W where W = ( 1/r12 + 1/r22 + ... + 1/rN2 ) Mozaic valuei = value of the ith projected data point that lies in the given CMAQ cell ri = distance between Mozaic point and CMAQ grid cell center 1 2 Layer 14 1 2 3 Layer 13 1