Download
1 / 54
540 likes | 606 Views
One model to rule them all?. Talk is about current framework, context. Many slides of details, equations, set aside for discussion.

E N D
Talk is about current framework, context. Many slides of details, equations, set aside for discussion. Focus on groundfish, groundfish issues and predator/prey models on “whole ecosystem” scale and climate links to “whole ecosystem” models and ones that have been LINKED TO MANAGEMENT PROCESS with Statistical considerations. “Lessons learned”. (May discuss some IBMs following Al’s presentation).
Groundfish-centric history of AFSC “ecosystem” models and issues • Laevastu 1970s – 1980s • Stock assessment focus: • Surplus production Limits on total fisheries production • (Indirectly) instrumental in developing Optimal Yield cap (imposed outside of model calculation) • Model next moves to Polovina to become ECOPATH. • Meanwhile…
Groundfish-centric history of AFSC “ecosystem” models and issues • Stock assessments • Predation mortality (cannibalism or multispecies) key to unpredictable interactions (i.e. pollock). Several examples, beginning Honkalehto 1988. • Climate becomes an obvious player, incorporated (correlations, mechanisms)
Groundfish-centric history of AFSC “ecosystem” models and issues • Then, all at once: EBFM, Steller Sea Lions, PSEIS • MSVPA (mainly for predation mortality of key species) Jurado-Molina and Livingston • Pollock prediction models (FOCI) : most valuable species was least predictable, most eaten by everything. • Bormicon/Gadget spatial model (never advanced) Livingston • Ecosim started as S.S.L focused-investigation (EBS found limited effects on scale of model) Trites and Livingston Now Ecosim for EBS, GOA, ALEUTIANS used for PSEIS style analyses. • Multispecies Bycatch Model • Steller models and IBMs • MRM models: Cod/Crab. Atka/Cod/Pollock/SSL.Quinn et al. GOA
Current issues • Programatic Supplemental Environment Impact Statement • Development of Ecosystem Considerations, designed to include trends but also model analyses. • Ecosystem Considerations are part of stock assessment process, regular reports to Council. • Modeling? • Include CUMULATIVE EFFECTS, OY analyses, etc. • Model policy tradeoffs: TAC EA and EIS • BiOp for Stellers
“Realist” • (Was a draft of a proposal for EcoFore, wasn’t submitted). Integration with management is key • NEED CONTEXT: Integrating ecosystem and habitat information into current single species management process • Integrating ecosystem information with more spatial habitat information • Developing and integrating multiple models with different scales and different simplifying assumptions “Non believer” “Believer”
Research survey Abundance data Commercial fishery Catch data Biological data: Catch at age, size Life history Ecosystem Stuff??? Stock assessment Plan Team Review Initial ABC OFL Advisory Panel Initial TAC Scientific & Statistical Committee Final ABC OFL North Pacific Fishery Management Council Public input Public input Final TAC specifications
Ecosystem Considerations Organization • Ecosystem Assessment • Summarize historical climate and fishing effects on BSAI and GOA • Summarize possible future effects of climate and fishing on ecosystem structure and function (using multi-species and ecosystem models)–in progress • MODELS for: what do the current indicators mean and what UNCOLLECTED indicators might be important and create testable hypotheses. • Ecosystem Status Indicators • Historical and current status and trends • Ecosystem-Based Mngt Indices • Early signals of direct human effects
How will multispecies models affect a catch level? • Crises • BiOp (endangered, threatened) • Strategic – never done explicitly • Cumulative effects of harvest rates • Optimum Yield (2,000,000 mt?) • Tradeoffs between species • Single species – several avenues, none explict or mandated • Currently part of “ecosystem considerations”, may affect Tiers. • Reference points (F-40) • Informational (qualitative MSE) • Management Strategy Evaluation • Addition of mortality to single species • Adjustment of uncertainty
Needed for ecosystem assessment • Issue driven or framework driven? (preparation for rapid scenario investigation in response to issues) • Many components or too many compoments? (140+ species, and not enough) • Precision or range of hypotheses? • Statistical preditions/fitting (must be “right”) • MSE operational models (must be inclusive of hypotheses) • Uncertainty, and also risk assessment • Data sensitivity
Conclusions I:Forecasting and Contingency Planning • Ecosystem models provide • Context of species relationships for current management • Fuller evaluation of uncertainty than single species models alone • Ability to simulate policy options under our control and • Ecosystem change outside our control • Developing a suite of integrated models • Can address specific questions at appropriate scales • Can evaluate uncertainty across and between models • Current models are in place for contingency planning, and quicker response during “crisis management” • Natural disaster • Lawsuit, EIS analysis
NOAA 5-year plan • Research milestone under“Scenario Development to Support Specific Management Actions and Decisions” “Develop the next generation of multi-species fisheries and food web production models (3-5 years).” • WHAT ABOUT NOW? • This talk focuses on operational or near-operational models (Alaska examples). • Operational = quantitative, for direct use in management context (either tactical or strategic). • Primarily predator prey or predator/prey/climate, stock or regional scale, limited spatial resolution. • MANY exploratory, in-development, not predictive in stock-assement context models exist or are in development.
State of the art Similar predictive issues to stock assessment • Functional response / model error? • Similar to issues Ricker v. Beverton-Holt in single-species management, fitting and robust statistical techniques are part of the solution. • Recruitment, climate drivers, gear/bycatch changes, management/economic effects not predictable (but these models can be driven by such inputs if the scenarios are described). • Current solutions: test hypotheses with “external forcing”, test management responses for robustness. • Next improvements should explore these forcings with COUPLED models of proposed mechanisms. But needs careful consideration of WHAT is predictable and WHEN it’s predictable! (Flatfish may be, pollock sometimes, herring ever? Some key characteristics and tools shown later may define which will work right now).
Model Definitions • Biomass dynamics • Ecopath with Ecosim • Elseas (AFSC version of Ecosim) – CIE Review • GEEM • Age-structured interactions • MSVPA –CIE Review • Bycatch Interaction Model • Individual interactions • IBMs (Hinckley et al.) • Bioenergetics • Minimum realistic models: Atka/Cod, Cod/crab, GOA (Terry Quinn) • Spatial interaction models (currently don’t exist) • Atlantis • GADGET • Highlighed are most advanced “statistically” (e.g. in stock assessment sense) • SLIDES CAN BE SHOWN AS NEEDED FOR SEVERAL Others OF THESE
<-statistical rigor but model error SS -> MRM ->Bycatch -> MSVPA/MSM -> Ecosim -> Gadget -> Atlantis detail and hypothesis inclusiveness -> • All of the above could develop more statistically. • Do we need to choose one, or do we need a framework for uncertainty, to make blended model predictions? • Why general models? You can’t start building specific models in a crises, but can spawn them off a big one.
“This Generation” • Multispecies Bycatch Model • Gear interactions, age structured single species dynamics, simple bycatch, complex management scenarios • (no predator/prey links) • MSVPA/MSFOR/MSSAM • Multispecies age structured predator/prey for 7 target species, adds explicit predation effects to recruitment hindcasts • (no bycatch or full system effects) • Ecopath/Ecosim • Complex system effects on non-target and protected species biomass dynamics, gear interactions, simple management scenarios • ELSEAS: full age structure for key species (forward fitting).
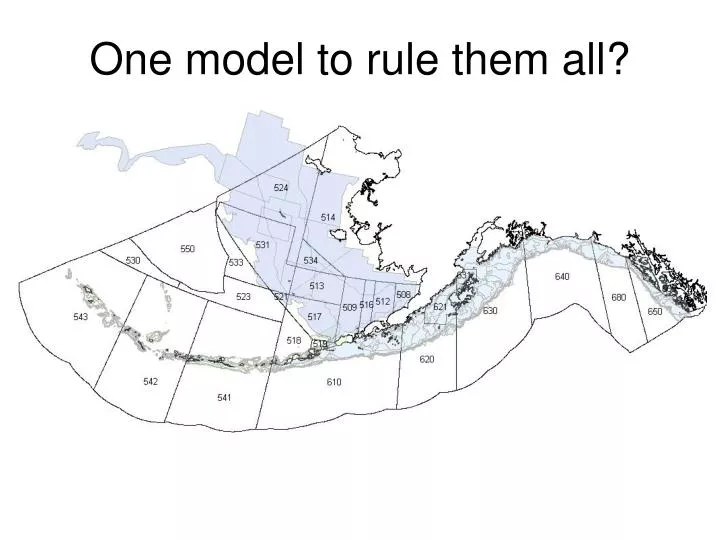
Current multispecies models • “Stock assessment” scale. • Calibrated from annual or quarterly data, may be subregional parameter partitioning (but no “true” spatial movement). • Main units are “stocks” on a “management/survey region” scale. • IBM or NEMURO/Fish: Explicit spatial movement, no population closure. Council areas
First: Information requirements • Standard stock assessment data • Biomass or abundance index • Productivity information • Fishery observation • Commercial catch • Incidental catch and discards • Food habits collections • Multiple species and trophic levels • Multiple seasons • Spatial resolution of data
Why Multispecies? SHIFTING BASELINES Key to uncertainty: this is MEDIAN % change over multiple climate scenarios and error range for inputs (error bars not shown).
Population-scale: dB/dt = ??? ALL RESPONSES ARE NONLINEAR, HARD TO SIMPLFY. Only way to evaluate these is to fit historical data, or test results for robustness over a range of parameter values.
SENSITIVITY RESULTS Ecopath food webs (EBS, GOA, AI) EBS food web
Example: The ecosystem role of Pacific cod varies between systems, especially in the AI (not in proportion to biomass).
Quantifying impacts and uncertainties from removal: Pacific cod example.
Quantifying factors influencing target species: Pacific cod example.
Forage fish v. squid
Common data issues • “Tier 4-6” resolution of individual stocks • OBSERVATION • Need continued food habits input (update ~5 years). • Need off-survey food habits data, especially late summer/early fall. • Need bycatch reconstruction, updating. Bycatch in non-NMFS fisheries? • PROCESS • Recruitment and climate drivers. • Euphausiid variability/uncertainty is a key bottom-up effect in all systems. • Deepwater food web (sablefish, grenadier, squid) poorly understood. • Squids are key, poorly understood component. • Not all species are equally predicable! (Why did we start with pollock??) Scales differ: (switch driven species by local studies, longer life-histories by correlative studies, etc.) • LEADS TO PREDICTABILITY STUDIES…
1990-1993 snapshot Gulf of Alaska groundfish
Predictability 1: hypotheses testing? • GOA – all have support – Final AIC under review, each fit in “different ways”, each give wildly different “best” functional response types and fits (ecosystem states). • Climate link to primary production (Ecosim) • Climate link to pollock recruitment (Elseas) • Fishing with arrowtooth recovery from POP fishery (assumes present-day bycatch q in that fishery) • EBS has food data available to do functional fitting and distingusih hypotheses, GOA data is limited for this purpose.
Food web networks GOA 2001: 307 nodes 1011 links EBS 2000: 277 nodes 1027 links
Predictability 2: Structural type Biological Regime:“Climate” forcing experiment • Band-pass filtered (white noise at annual and higher timescales) for all species
Juv. pollock Adu. pollock GOA food web is less predictable than EBS for adult pollock: this is emergent property. SCALE for data-needs differs and is species and ecosystem specific!
Linking models: Ecosim and scale?? • SCALE doesn’t work for our purposes (linking ecosystems, investigating climate interactions in species with strong seasonal, migratory, or bottleneck dynamics). • Ecosim on its own works well for stock-scale top-down perturbations (fishing) on relatively closed populations, NOT for mechanisms: in particular, VERY poor for Pacific salmon.
NEMURO vs. ECOSIM NEMURO output drives seasonality in primary and secondary production in Ecosim RESULT: NEMURO predatory zooplanktion vs. Ecosim Euphausiids
NEMURO vs. ECOSIM Ecosim gelatinous zooplankton and forage fish Large predators, and salmon (???)
Pink salmon bioenergetics model, predicts daily pink salmon growth and numerical mortality based on input ration. Pink salmon body weight and numbers used to set Ecosim biomass for predator and prey equations in next timestep. Consumption and mortality rates for Pink salmon based on predator and prey biomass. Ecosim (ecosystem biomass dynamics model), run on a daily timestep. No direct feedback to NEMURO: Ecosim parameters for predatory zooplankton (euphausiids) tuned to match NEMURO predictions for same species. Daily biomass density of phytoplankton, microzooplankton, large zooplankton (copepods). NEMURO (nutrient-phytoploankton-zooplankton-detritus): 1-dimensional water column model integrated on an hourly timestep. Didn’t capture salmon well, so made model linkages
Pink salmon growth (Ishida et al. 1998)
Additional data OSP temperature Prey quality
Matching growth rates Original run Run calibrated for “fast growth” (fits base growth rate to later data points)
Sensitivity analysis Original run % change in input variable % change in final pink salmon body weight
Finally: mixed layer depth Original run Mixed-layer depth Fast growth Density dependence Concentration of prey density inversely proportional to mixed-layer depth.