Download
1 / 51
510 likes | 597 Views
General understanding of electronic transport properties in solid alloys (amorphous and recrystallized one’s). In other words: does this formalism developped for liquids also describe solids?.

E N D
General understanding of electronic transport properties in solid alloys (amorphous and recrystallized one’s).In other words:does this formalism developped for liquids also describe solids? Gasser Jean-Georges1, Abadlia Lakhdar1, Khalouk Karim1, Gasser Françoise1, Kaban Ivan2, Aboki Tiburce3 and Moussa Mayoufi4. 1 Laboratoire de Physique des Milieux Denses,Université Paul Verlaine- Metz, France.2Institut für Physik Technische Universität Chemnitz Germany.3 Laboratoire de MétallurgieStructurale ENSCP Paris.4Laboratoire de Chimie des Matériaux Inorganiques, Université Badji-Mokhtar Annaba, Algéria
What do we understand under « electronic transport propertie »?
By electronic transport we understand: • The electrical resistivity. (Microscopic Ohm’s law) • The thermal conductivity. (Fourier law) • The Absolute Thermoelectric Power (ATP) or Thermopower or Seebeck coefficient of a couple or of an element. (Device called thermocouple used for measuring temperature) • The Peltier coefficient of a couple or of an element. (Used for a device called Peltier device for cooling objects like PC’s processors) • The Thomson coefficient of an element.
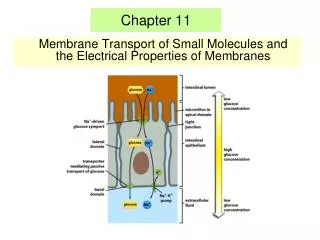
THE ELECTRONIC TRANSPORT COEFFICIENTS Gradient of temperature l Thermal Conductivity Density of heat flux Gradient of potential Density of current s Electrical Conductivity Cause Effect Physical property • Crossed effects: 3 thermoelectric effects: • Seebeck effect (or Absolute Thermoelectric Power) • Peltier effect • Thomson effect
Composition of Chromel: Ni90 Cr10 Composition of Alumel: Ni94Al3Si1Mn2 (in weight %) Ref: Heikes and Ure Interscience 1961
Why is the thermopower of chromel (Ni90 Cr10) positive while that of alumel (Ni94Al3Si1Mn2 )is negative ?
THERE ARE WELL KNOWN INDUSTRIAL USE OF ELECTRONIC TRANSPORT • The Seebeck effect is for measuring temperatures. One expects that the Seebeck coefficient is as constant as possible to be used reproducebly • In a Peltier device, intense research is done in order to get the best figure of merit by increasing S and s and decreasing l
THE USE OF THERMOPOWER FOR NON DESTRUCTIVE TESTING IS NOT WELL KNOWNA workshop has been organised in 2002 in Lyon by Kleber on this subject
One has learned that TEP is used to follow microstructural transformations as function of time Massardier presentation colloque TEP INSA-LYON 2002
One has learned that TEP is used to follow tempering of nuclear reactors steel Analysis of ageing of nuclear reactors steel after Houzé (INSA Lyon) TEP INSA-LYON 2002
One has learned that TEP is used to scan a surface. The map can be compared to that of the segregation of alloys Correlation between segregation and ThermoElectric Power (TEP) after Kleber (INSA Lyon) colloque TEP INSA-LYON 2002
These very interesting phenomena led us to examine by ourself the resistivity and thermopower changes in solids and to try to understand and to explain them.
OUR NEW MEASUREMENTS • Wedevelopped an automatic system to measuresimultaneously the resistivity and thermopower of solidalloys. It isbased • On a « labview » driving program. • On a resistivitymeasurementmethod. • On a thermopower smallDT technique. The experimentismounted in a furnacewith a programmable temperatureregulator. The sampleis put under vacuum or inertatmospher.
The labview software (registered) has been written by Françoise Gasser) The software must be configurated. The data of the thermoelements in contact with the sample and of the thermocouples must be introduced
One can measure automatically either the resistivity alone (right diagram). The temperature gradient is checked (left diagram). All results are recorded in excel files
One can measure automatically the thermopower alone (right diagram). The temperature is oscillating (left diagram) between -2 and +2 Celsius around an increasing or decreasing temperature. One can also measure simultaneously both the resistivity and the thermopower.
ABADLIA THESIS In the first experiment we measured resistivity (in blue) and absolute thermoelectric power (in red) for the amorphous Fe40-Ni38-B18-Mo4 . The temperature increases and decreases is at a rate of 0.4K/minute. There is an initial change in resistivity around 380 ° C. A second one on the resistivity and the TEP above 465 ° C, a third change in slope in the resistivity and TEP occurs above 640 ° C. The increasing temperature curve is very different from the decreasing one. At room temperature resistivity was divided by 2.5 and the TEP goes from -3 to -37mV/K
ABADLIA THESIS In a second experiment we carry out cycles and periods of waiting several hours at constant temperature. We first stopped at 300 ° C well below the transition temperature located (380 ° C), we decrease to 100 ° C and then go up to 380 ° C. The curves are superimposed this means that no phase transformation took place. At 380 ° C we wait 1H. We observe a small resistivity decreases. To decrease faster we increase from 20 ° C and waited 8H (see figure below). At the end of this waiting period a descent to 350 ° C and a rise to 400 ° C are superimposed. The descent blocks the evolution of the alloy up to 430 °C. Around 470 ° C the resistivity begins to increase. We then wait during 8H at 475 ° C.
ABADLIA THESIS We observe, at constant temperature, a curve resembling an exponential decay which seems to reach an asymptotic value.
ABADLIA THESIS At 475 °C the TEP increases exponentially as A(1-exp (-Bt)). The time constant is much shorter than at 400°C. After 3H no further change is observed
Nanos grains (10 nm) micro grains (1-10 mm) No grains (amorphous) ABADLIA THESIS Observation of samplewith a SEM
T amb TEM TEM Recuit 18H 430°C 750°C 400°C 500°C ABADLIA THESIS TEM and X rays from ABOKI Tiburce
Manythermodiffractograms have been measured by neutron scattering by Souberoux and coworkersat ILL
First conclusions • Resistivity and TEP are very sensitive to the morphology and to the cristallinity of the alloys. • Temperature cycles can prove that no transformation occur • A time constant due to a transformation can be measured at constant temperature both on resistivity and on thermopower • The changes of resistivity and thermopower are correlated to a change of crystalline structure as can be observed by SEM and TEM • The change of resistivity and thermopower are correlated to a change of atomic structure as can be observed by X ray scattering. • An alternative technique is the thermodiffractograms measured by neutron scattering, but everybody has not a high flux reactor in his lab.
KHALOUK THESIS AS FUNCTION OF TEMPERATURE Ni80P20 Ni63.7Zr36.3
KHALOUK THESIS AS FUNCTION OF TEMPERATURE Ni36.5Pd36.5P27 Fe80Si6B14
KHALOUK THESIS As function of thermal cycles Ni80P20
As function of time at constant temperature KHALOUK THESIS Ni63.7Zr36.3
Experimental conclusion: • A resistivity and thermopower measurement device is a very powerfull tool to study phase transformations. • Its advantage (compared to DSC) is that we can follow phase transformations at constant temperature.
ELECTRONIC TRANSPORT FOR LIQUID AND AMORPHOUS METALS (AND ALLOYS)
On what is based the theory of disordered metals? • Boltzman equation • Nearly free electron theory : density of states ≈E0.5 • Space isotropy • Short range order, high distance disorder • Scattering theory: each electron interacts with scatterers • Factorisation: In Ziman’s integral, the interaction of conduction electrons with matter is the squared form factor (or t matrix characteristic of the scattering) times the structure factor characteristic of the relative position of the scattering sites
Ziman theory The Ziman free electron approach gives a pretty good description of the resistivity and ATP of liquid metals. If we crudely approximate the product : a(q)t2(q) by a constant one can then integrate analytically. One obtains: a(q) Consequence: the ATP of liquid metals is always negative
Modulation of the 1/E curve by the structure factor But some liquid metals have a positive thermopower. The 1/E resistivity curve is modulated by the maximum of the structure factor. If the Fermi energy is on the increasing side of the resistivity curve the thermopower is positive. This is the case for noble and divalent metals which present a positive thermopower
Modulation of the 1/E curve by the squarred density of states Mott proposed to correct the mean free path at the Fermi energy: Faber demonstrated that : Consequently: One can correct the calculation of at the Fermi energy Our proposition: use the Hafner density of states to correct the resistivity by g2(E)in the whole domain of energy, then derivate it to obtain the thermopower.
Modulation of the 1/E curve by the squarred density of states Mott proposed to correct the mean free path at the Fermi energy: Faber demonstrated that : Consequently: One can correct the calculation of at the Fermi energy Our proposition: use the Hafner density of states to correct the resistivity by g2(E)in the whole domain of energy, then derivate it to obtain the thermopower.
Modulation of the 1/E curve by the resonant scattering The squared t matrix has a résonance for transition metals. If the Fermi energy is on the left side of the resonnance (the thermopower is positive (Sc, Ti) If it is on the right side the TEP is negative (nickel). Zrouri thesis
To summarize, the resistivity versus energy curve is a 1/E function modulated by : • the structure factor • the ratio of the squared density of states • divided by the free electron density of states • the squared t matrix (resonant scattering • for transition metals • The ATP is positive on the left side of each of these modulating functions.
What changes in solids? • For monocristals, the space is no more isotropic. • There is a « large distance » ordering • The electronic « transport properties » are very sensitive to physical and mechanical properties. • The change of resistivity can be very important • The change of thermopower can be very important • The sign of the thermopower is not understood. Electronic Transport properties are used for non destructive testingin industry
KHALOUK THESIS Fe82Si2B16
Fe82Si2B16 Kaban’s structure factor 420°C 45
Fe82Si2B16 KHALOUK THESIS 16 and 20H After 20H, the structure no more changes 12H 1H 0.25H 2kF 46
Ge-Te may be interpreted within this scheme Kaban’s structure factor
Physical interpretation • The four last slides are the (at least qualitative) experimental proof that the Faber-Ziman formalism can also be used for crystalline solids • As for liquid and amorphous materials, the resistivity versus energy curve is modulated by the (sharper) structure factor • The position of the Fermi energy in the resistivity versus energy curve is the crucial point
At the beginning of this presentation I asked : Why is the thermopower of chromel (Ni90 Cr10) positive while that of alumel (Ni94Al3Si1Mn2 )is negative ? My answer is that very probably: impurities (Cr or Al…) move the Fermi energy from the left (chromel) to the right (alumel) side of a nickel structure factor peak as on the figure Kaban’s structure factor