Download
1 / 35
360 likes | 580 Views
Input/Output: Organization, Disk Performance, and RAID. An example I/O performance question:. How long does it take to rip a CD? Why?. I/O Device Examples and Speeds. I/O Speed: bytes transferred per second (from keyboard to Gigabit LAN: 7 orders of magnitude )

E N D
An example I/O performance question: • How long does it take to rip a CD? Why?
I/O Device Examples and Speeds • I/O Speed: bytes transferred per second(from keyboard to Gigabit LAN: 7 orders of magnitude) • Device Behavior Partner Data Rate (KB/s) Keyboard Input Human 0.01 Mouse Input Human 0.02 Audio Output Human 100.00 Magnetic Disk Storage Machine 10,000.00 Wireless Network I or O Machine 10,000.00 Graphics Display Output Human 30,000.00 Wired LAN Network I or O Machine 125,000.00 Bandwidth to GPU & Memory >1,000,000.00
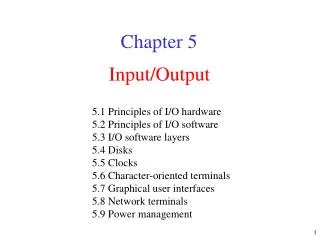
The Hardware (the motherboard) CPU socket Serial, parallel, and USB ports Memory slots IDE drive connectors (Back) (Front) graphics card slot PCI slots
CPU North Bridge chip Graphics port Video card Memory PCI bus South Bridge chip PCI slots Networking Sound card Disk controller Serial, parallel and USB ports Hard disks CD-ROM How is it all connected? (Hierarchy!)
CPU North Bridge chip Graphics port Video card Memory PCI bus South Bridge chip PCI slots Networking Sound card Disk controller Serial, parallel and USB ports Hard disks CD-ROM How does the data flow when you rip?
What’s Inside A Disk Drive? Spindle Arm Platters Actuator Electronics (including a processor and memory!) SCSI connector Image courtesy of Seagate Technology
Disk Geometry • Disks consist of platters, each with two surfaces. • Each surface consists of concentric rings called tracks. • Each track consists of sectors separated by gaps. Tracks Surface Track k Gaps Spindle Sectors
Disk Geometry (Muliple-Platter View) • Aligned tracks form a cylinder. Cylinder k Surface 0 Platter 0 Surface 1 Surface 2 Platter 1 Surface 3 Surface 4 Platter 2 Surface 5 Spindle
Disk Capacity • Capacity: maximum number of bits that can be stored. • Vendors express capacity in units of gigabytes (GB), where1 GB = 109 Bytes. • Capacity is determined by these technology factors: • Recording density (bits/in): number of bits that can be squeezed into a 1 inch segment of a track. • Track density (tracks/in): number of tracks that can be squeezed into a 1 inch radial segment. • Areal density (bits/in2): product of recording and track density.
Computing Disk Capacity Capacity = (# bytes/sector) x (avg. # sectors/track) x (# tracks/surface) x (# surfaces/platter) x (# platters/disk) Example: • 512 bytes/sector • 300 sectors/track (on average) • 20,000 tracks/surface • 2 surfaces/platter • 5 platters/disk Capacity = 512 x 300 x 20000 x 2 x 5 = 30,720,000,000 = 30.72 GB
The read/write head is attached to the end of the arm and flies over the disk surface on a thin cushion of air. By moving radially, the arm can position the read/write head over any track. Disk Operation (Single-Platter View) The disk surface spins at a fixed rotational rate spindle spindle spindle spindle spindle
Disk Operation (Multi-Platter View) Read/write heads move in unison from cylinder to cylinder Arm Spindle
Surface organized into tracks Tracks divided into sectors Disk Structure - top view of single platter
Disk Access Head in position above a track
Disk Access Rotation is counter-clockwise
Disk Access – Read About to read blue sector
Disk Access – Read After BLUEread After reading blue sector
Disk Access – Read After BLUEread Red request scheduled next
Disk Access – Seek After BLUEread Seek for RED Seek to red’s track
Disk Access – Rotational Latency After BLUEread Seek for RED Rotational latency Wait for red sector to rotate around
Disk Access – Read After BLUEread Seek for RED Rotational latency After RED read Complete read of red
Disk Access – Service Time Components After BLUEread Seek for RED Rotational latency After RED read Data transfer Seek Rotational latency Data transfer
Disk Access Time • Average time to access some target sector approximated by : • Taccess = Tavg seek + Tavg rotation + Tavg transfer • Seek time (Tavg seek) • Time to position heads over cylinder containing target sector. • Typical Tavg seek is 3—9 ms • Rotational latency (Tavg rotation) • Time waiting for first bit of target sector to pass under r/w head. • Tavg rotation = 1/2 x 1/RPMs x 60 sec/1 min • Typical Tavg rotation = 7200 RPMs • Transfer time (Tavg transfer) • Time to read the bits in the target sector. • Tavg transfer = 1/RPM x 1/(avg # sectors/track) x 60 secs/1 min.
Disk Access Time Example • Given: • Rotational rate = 6,000 RPM • Average seek time = 3 ms. • Avg # sectors/track = 400. • Time to access a random sector: • Tavg rotation = • Tavg transfer = • Taccess = • Important points: • Access time dominated by seek time and rotational latency. • First bit in a sector is the most expensive, the rest are free. • SRAM access time is about 4 ns/doubleword, DRAM about 60 ns • Disk is about 40,000 times slower than SRAM, • 2,500 times slower then DRAM.
Disk Access Time Example, cont. • Given: • Rotational rate = 6,000 RPM • Average seek time = 3 ms. • Avg # sectors/track = 400. • Time to access 40 consecutive sectors: (20KB file = 40 sectors) • Tavg rotation = • Tavg transfer = • Taccess = • Time to read a whole track: (200KB file = 390 sectors) • Taccess = • Important points: • Try to lay out files contiguously for high bandwidth reading/writing!
Recording Zones: • Modern disks partition tracks into disjoint subsets called recording zones • Each track in a zone has the same number of sectors, determined by the circumference of innermost track. • Each zone has a different number of sectors/track • Outside tracks have more sectors • Same rotation speed • Higher MB/sec
Solid State Disks (SSDs) I/O bus • Pages: 512KB to 4KB, Blocks: 32 to 128 pages • Data read/written in units of pages. • Page can be written only after its block has been erased • A block wears out after 100,000 repeated writes. Requests to read and write logical disk blocks Solid State Disk (SSD) Flash translation layer Flash memory Block 0 Block B-1 … … … Page 0 Page 1 Page P-1 Page 0 Page 1 Page P-1
SSD Performance Characteristics • Why are random writes so slow? • Erasing a block is slow (around 1 ms) • Write to a page triggers a copy of all useful pages in the block • Find an used block (new block) and erase it • Write the page into the new block • Copy other pages from old block to the new block Sequential read tput 250 MB/s Sequential write tput 170 MB/s Random read tput 140 MB/s Random write tput 14 MB/s Rand read access 30 us Random write access 300 us
SSD Tradeoffs vs Rotating Disks • Advantages • No moving parts faster, less power, more rugged • Disadvantages • Have the potential to wear out • Mitigated by “wear leveling logic” in flash translation layer • E.g. Intel X25 guarantees 1 petabyte (1015 bytes) of random writes before they wear out • In 2010, about 100 times more expensive per byte • Applications • MP3 players, smart phones, laptops • Beginning to appear in desktops and servers
Storage Trends SRAM Metric 1980 1985 1990 1995 2000 2005 2010 2010:1980 $/MB 19,200 2,900 320 256 100 75 60 320 access (ns) 300 150 35 15 3 2 1.5 200 DRAM Metric 1980 1985 1990 1995 2000 2005 2010 2010:1980 $/MB 8,000 880 100 30 1 0.1 0.06 130,000 access (ns) 375 200 100 70 60 50 40 9 typical size (MB) 0.064 0.256 4 16 64 2,000 8,000 125,000 Disk Metric 1980 1985 1990 1995 2000 2005 2010 2010:1980 $/MB 500 100 8 0.30 0.01 0.005 0.0003 1,600,000 access (ms) 87 75 28 10 8 4 3 29 typical size (MB) 1 10 160 1,000 20,000 160,000 1,500,000 1,500,000
RAID : Redundant Array of Inexpensive Disks • Problem: Disks fail -> total data loss • Improving reliability of a disk is expensive. • Cheaper just to buy a few extra disks. • Idea: ECC for your disks • Files are “striped” across multiple disks • Redundancy yields high data availability • Disks will still fail • Contents reconstructed from data redundantly stored in the array • Capacity penalty to store redundant info • Bandwidth penalty to update redundant info • A multi-billion industry 80% non-PC disks sold in RAIDs
Common RAID configurations RAID 0No redundancy, Fast access RAID 1 Mirror Data, most expensive sol’n RAID 3/4 Parity drive protects against 1 failure RAID 5 Rotated parity across all drives
Summary • I/O devices are much slower than processors. • Engineered to be accessible, but to not slow down computation • Spindle-based devices: • Access time = seek time + rotational delay + transfer time • Lay files out contiguously! • RAID: Redundant Array of Inexpensive Disks • Achieve reliable storage, but not by making reliable disks • Use redundancy (e.g., parity) to reconstruct lost disk