Download
1 / 56
560 likes | 686 Views
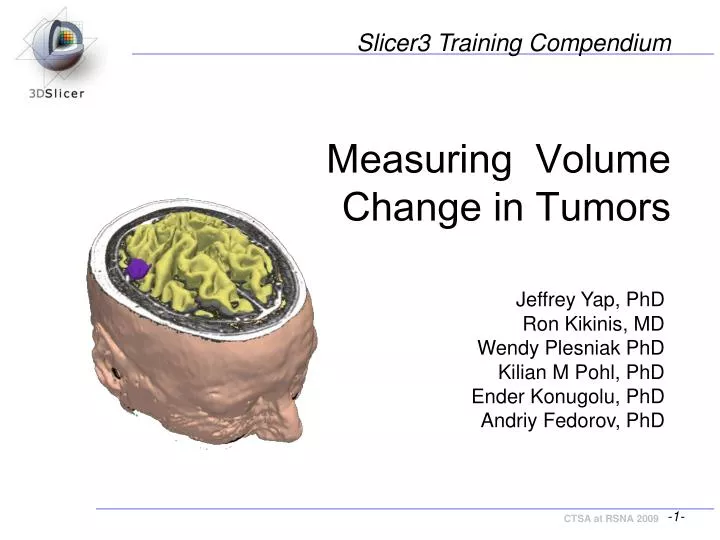
Slicer3 Training Compendium. Measuring Volume Change in Tumors. Jeffrey Yap, PhD Ron Kikinis, MD Wendy Plesniak PhD Kilian M Pohl, PhD Ender Konugolu, PhD Andriy Fedorov, PhD. Data. This course is built upon two scans of a patient with meningioma:. MR Scan 1. MR Scan 2.

E N D
Slicer3 Training Compendium Measuring Volume Change in Tumors Jeffrey Yap, PhD Ron Kikinis, MD Wendy Plesniak PhD Kilian M Pohl, PhD Ender Konugolu, PhD Andriy Fedorov, PhD
Data This course is built upon two scans of a patient with meningioma: MR Scan 1 MR Scan 2 Please note: we have pre-adjusted the window and level settings for these volumes so that they are appropriate for display on most laptops. If display is not satisfactory on your machine or projector, the Volumes Module may be used to refine these settings.
Data Clinical context Baseline: June 2006 Follow-up: June 2007 Baseline radiologist’s impression: • large falcine lesion is identified. • measures 3.1 cm anteroposteriorly, 3.05 cm from side-to-side, 3.5 cm in height. • enhances moderately on post gadolinium imaging. Follow-up radiologist’s impression: • left frontal lobe mass appears unchanged on all series. • measures 3.3 x 3.2 cm in maximum dimension. • enhances moderately on post gadolinium imaging. How has the tumor changed?
Overview Part I: Applying RECIST methodology Part II: Measuring volume change in tumors using ChangeTracker
Part I Standard Response Evaluation Criteria in Solid Tumors (RECIST) using 3D Slicer Jeffrey Yap, PhD Ron Kikinis, MD Wendy Plesniak, PhD
Response Evaluation Criteria in Solid Tumors (RECIST) Methodologies: WHO: Largest diameter and its perpendicular RECIST: Largest diameter (LD) only. Assessment criteria: • CR (complete response) = disappearance of all target lesions • PR (partial response) = 30% decrease in the sum of the longest diameter of target lesions • PD (progressive disease) = 20% increase in the sum of the longest diameter of target lesions • SD (stable disease) = small changes that do not meet above criteria
Learning objective Following Part I of this tutorial, you’ll be able to use 3D Slicer to: • Load a MRML Scene file, • Visually assess the response to therapy, • Make quantitative linear measurements across tumor cross sections, and • Make quantitative volume measurements of tumor anatomy • Assess according to RECIST criteria.
Quick overview of Slicer3 GUI Menu Toolbar The Graphical User Interface (GUI) of Slicer3 integrates five components: • the Menu Toolbar • the Module GUI Panel • the 3D Viewer • the Slice Viewer • the Slice and 3D View Controller 3DViewer Module GUI Panel Slice Viewer Slice and 3D View Controller
Close any previous scene Select File->Close Scene: This removes any datasets previously loaded into Slicer.
Loading data using a MRML scene file Using File->Load Scene: This raises the Load Scene Interface • select the file RECIST-Simple.mrml • double click the file, or click Open
Loading data: quick look at both image volumes The image volume 2006-spgr should be displayed in the background BG layer. The image volume 2007-spgr should be displayed in the foreground FG layer. Use the FG/BG toggle button and the Fade Slider to see both volumes. Toggle BGonly Fade FGonly
Explore the datasets Scroll in any Slice Viewer to look for large tumor cross sections Zoom in the Slice Viewers by Right-Clicking and dragging forward or back with the mouse. Pan in the Slice Viewers by Middle-Clicking and dragging with the mouse. Left-Click-and-drag in the 3D Viewer will rotate the view
Loading data: quick look at both image volumes Using Modules Menubutton: Expose the menu and select the Fiducials Module. Side Note: The Fiducials Module is powerful and functionality-rich. Learn more about it here: http://www.slicer.org/slicerWiki/index.php/Modules:Fiducials-Documentation-3.4
Using Fiducials for linear measurement Pick Place Transform Notice the Mouse Mode Toolbar for specifying the Mode of Interation Slicer is currently in “Transform Mode”
Using Fiducials for linear measurement Select Place Mode, to Place Fiducial Points NOTE: In Place Mode any Left-mouse-button click in a viewer will create a new fiducial point at the spatial location within the volumetric frame of reference.
Using Fiducials for linear measurement Scroll to the –5.1565 mm position in the Sagittal Slice Viewer Click and Drag the Right Mouse Button to zoom in. Click and Drag the Middle Mouse button to center the tumor.
Using Fiducials for linear measurement Click with the left mouse button to place two fiducial points along the long diameter. THEN Change back to Transform Mode
Using Fiducials for linear measurement Move the mouse over either fiducial point. When it turns yellow, you can move it by clicking and dragging with the left mouse button. Note the magnified region around the cursor in the bottom-most GUI panel.
Using Fiducials for linear measurement The distance measurement (mm) will be updated in the Fiducial’s GUI panel.
Using Fiducials for linear measurement Toggle between foreground and background to observe the corresponding slice and adjust the measurement for the follow-up study.
Compute tumor volume using segmentation Link all Slice Viewers using theLink Toggle if they are unlinked linked Unlinked Select the 2006-spgr-labelTumor Mask in the LB layer Select the Nonevolume in the FG layer The tumor segmentation for the baseline volume is displayed
Compute tumor volume Using Modules Menubutton: Expose the menu and select the LabelStatistics module under the Statistics group.
Compute tumor volume Specify 2006-spgr as the Input Greyscale Volume Specify 2006-spgr-label as the Input Labelmap Click Apply. The tumor volume for label 6 (green) is shown in mm3
Assessment The same analysis may be done for the follow-up study: Specify 2007-spgr as the Input Greyscale Volume Specify 2007-spgr-label as the Input Labelmap And click Apply. Final RECIST tumor metrics: LD (mm) CD (mm) V mm3 2006-spgr 32.24 17432.05 37.72 2007-spgr 36.67 31.97 17458.24 % change: -2.78% -0.84% 0.15%
Summary RECIST methodology: Is an effective approach for measuring sizeable changes in tumor size and assessing tumor response to therapy. We are developing new analysis tools in 3D Slicer for assessing change over time, including when the changes are small.
New tools 3D Slicer’s LabelDiameterEstimation module (available currently only in the Slicer nightly builds), will automatically compute the largest tumor diameter given an initial segmentation. Baseline: June 2006 Follow-up: June 2007
New tools 3D Slicer’s Measurements module, is developing a measurement widget that operates in the 3D Viewer and the Slice Viewers. (the prototype version is available in Slicer’s nightly builds).
New tools 3D Slicer’s ChangeTracker module can assess volumetric changes at the voxel-level.
Part II Analyzing Small Volumetric Changes using the ChangeTracker Module Kilian M Pohl, PhDEnder Konugolu, PhD Andriy Fedorov, PhD The module described in this tutorial was tested on Axial 3D SPGR T1 post Gadolinium scans (Voxel dimension: 0.94mm x 0.94mm x 1.20mm, FOV: 240mm, Matrix: 256 x 256)
Close any previous scene Select File->Close Scene: This removes any datasets previously loaded into Slicer.
Loading training dataset Select File->Load Scene: This raises the Load Scene Interface • select the file: ChangetrackerTutorial2009.mrml • double click the file, or click Open
Change Layout to Four-up Using the Layout MenuButton Select Four-up layout.
Select ChangeTracker Module Using the Modules Menubutton, Select the ChangeTracker Module from the Wizards category.
Workflow Wizard • The Workflow Wizard guides the user through a sequence of steps and has the following components: • the Step Panel • the User Panel • the Navigation Panel Step Panel User Panel Navigation Panel
Select Scans Select: Scan 1 = 2006-spgr Scan 2 = 2007-spgr
Zoom in Move sliders to see tumor Zoom in (Right mouse down and push/pull) Press Next
Identify Volume of Interest Press Display volume rendering and VOI label A VOI Box Widget is positioned within the volume, and its blueextent is displayed in each Slice Viewer Right mouse click in the tumor center.
Identify Volume of Interest Right mouse click in any Slice Viewer to adjust VOIcenter Left mouse click in any Slice Viewer to change the VOI extent VOIbox widget and volume rendering of tumor in yellow
Identify Volume of Interest Fine-tune the VOI using the VOI Widget range sliders or by moving the VOI Widget handles in 3D view VOI Widget range sliders are color-coded to match VOI box Widget handles in 3D Viewer
Identify Volume of Interest Scroll through slices to ensure that tumor boundaries are included in the VOI Click Next
Change Segmentation by moving range slider Segment Tumor 3D Viewer shows model of tumor Slice Viewers show VOI with current segmentation overlay in light yellow
Segment Tumor Press Grid to view grid with original voxel size (You may need to pan/zoom in slice viewers to refresh their display)
Segment Tumor Press Slice to see the first scan in the 3D Viewer Note: The 3D View can be reset using the Axis Navigator Widget
Press Next Segment Tumor
Select fast and press Analyze Choose Metric Type • Choice of Metric: • Detect change by analyzing intensity pattern (fast) • Measure change by analyzing deformation map (slow)
Analysis I: Volume Preserving Registration Before Afterwards Konukoglu et al. ,“Monitoring Slowly Evolving Tumors”, ISBI, 2008
Analysis II: Normalize Intensities Scan 1 Scan 2 Scan 2 - Norm Konukoglu et al. ,“Monitoring Slowly Evolving Tumors”, ISBI, 2008
Analysis III: Detect Change – Intensity Based PDF of Dormant Tissue Determine probability density function Define region of static tissue - = Compute statistics of static tissue: Subtract Scan2 from Scan1
Analysis III: Detect Change – Intensity Based Data Analysis Mode : Sensitive Moderate Robust False Positive Risk: High Medium LowGrowth (mm3) : 1301 547 100 Growth (voxel): 1057 444 81 Konukoglu et al. ,“Monitoring Slowly Evolving Tumors”, ISBI, 2008
Mode : Jaccobian Growth (mm3) : 1291 Growth (voxels): 1049 Mode : Segmentation Growth (mm3) : 1386 Growth (voxels): 1126 Compute Jacobian or Apply mapping to segmentation Analysis III: Detect Change–Deformation Map = Determine change via mapping: Compute diffeomorphic mapping between scans