Download
1 / 38
380 likes | 657 Views
PARCC Results: Year One Montgomery township school district Damian Pappa director of data assessment & accountability January 19, 2016. Measuring College and Career Readiness. Vision for public education in New Jersey.

E N D
PARCC Results: Year OneMontgomery township school districtDamian Pappadirector of data assessment & accountabilityJanuary 19, 2016 Measuring College and Career Readiness
Vision for public education in New Jersey “New Jersey will educate all students to prepare them to lead productive, fulfilling lives. Through a public education system that is seamlessly aligned from pre-school to college, students will gain the requisite academic knowledge and technical and critical thinking skills for life and work in the 21st century.”
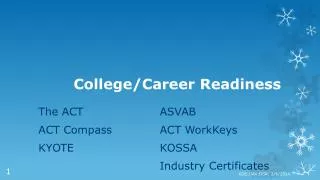
Raising standards College and Career Ready Standards “Align New Jersey high school standards and graduation requirements to college and workforce entry requirements.” – NJ High School Redesign Steering Committee (HSRSC - 2008) New Jersey has adopted standards that “are widely recognized as appropriate standards for college and career readiness.” - College and Career Ready Taskforce (CCRT - 2012) 2009: New Jersey adopted higher course taking requirements for all students. 2010: New Jersey adopted the Common Core State Standards in English Language Arts and Mathematics.
“Currently the New Jersey High School Proficiency Assessment (HSPA) does not measure college or work readiness…Further, New Jersey colleges and universities do not use scores from the HSPA for admissions or placement, because the test does not reflect postsecondary placement requirements.” (HSRSC - 2008) Next steps:Replace HSPA
A System of Aligned Assessments “Replace HSPA with a series of end of course assessments in math… and a proficiency exam in language arts literacy that are aligned with the expectations of higher education and the workplace.” (HSRSC - 2008) Current tests should be “replaced with a system of end-of-course assessments.” (CCRT - 2012) ImprovingstudentAssessment 2015: New Jersey adopted the Partnership for Assessment of Readiness for College and Careers (PARCC) assessments in English Language Arts/Literacy and Mathematics.
New jersey’s statewide assessment program • In 2015, New Jersey adopted the Partnership for Assessment of Readiness for College and Careers (PARCC) to replace HSPA and previous assessments in the elementary and middle school in language arts and mathematics. • Students took PARCC English Language Arts and Literacy Assessments (ELA/L) in grades 3–11. • Students took PARCC Mathematics Assessments in grades 3–8 and End of Course Assessments in Algebra I, Geometry, and Algebra II.
PARCC Consortium • The Partnership for Assessment of Readiness for College and Careers (PARCC) is a consortium of states that develop assessments to measure student achievement in English Language Arts/Literacy and Mathematics. • In addition to New Jersey, Arkansas, Colorado, District of Columbia, Illinois, Maryland, Massachusetts, Mississippi, New Mexico, Ohio, and Rhode Island participated in the 2014–2015 PARCC administrations.
Setting A New Baseline • The PARCC assessments are based on the grades 3–8 and high school Common Core State Standards (CCSS). • They focus on the skills students need in today’s world, including critical thinking, problem solving, and reasoning. • Because the PARCC assessments measure these complex skills, which are different from previous state tests, scores on the PARCC test will look lower.
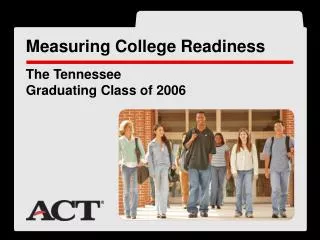
PARCC Outcomes in context 2015 SAT: 44% met College and Career Ready Benchmark 2015 ACT: 43% met College and Career Ready Benchmark. NAEP: National Assessment of Educational Progress https://nces.ed.gov/nationsreportcard/ ADP: American Diploma Project http://www.achieve.org/adp-network
Spring 2015 Administration • The 2015 spring administration of PARCC English Language Arts/Literacy and Mathematics assessments included two test windows. • The first window was for administration of the Performance-Based Assessment (PBA). • The second window was for the administration of the End-of-Year (EOY) assessment. • A student must have participated in both windows to receive a summative PARCC score.
Spring 2015 Performance Based Assessment (PBA) • The PBA administration occurred after approximately 75 percent of instructional time was complete. • The ELA/L PBA focused on writing effectively when analyzing text. • The mathematics PBA focused on applying skills and concepts and solving multi-step problems that required abstract reasoning, precision, perseverance, and strategic use of tools.
Spring 2015 PARCC End Of Year (EOY) • The EOY administration occurred after approximately 90 percent of instructional time was complete. • For the EOY, students demonstrated their acquired skills and knowledge by responding to machine-scored item types.
PARCC Performance levels • Level 1: Not yet meeting grade-level expectations • Level 2: Partially meeting grade-level expectations • Level 3: Approaching grade-level expectations • Level 4: Meeting grade-level expectations • Level 5: Exceeding grade-level expectations
2015 PARCC Consortium grade-level OutcomesEnglish language arts/literacy Note: Numbers may not sum to 100% due to rounding.
2015 New JerseyPARCC grade-level OutcomesEnglish language arts/literacy Note: Numbers may not sum to 100% due to rounding.
2015 Montgomery township school District PARCC GRADE-LEVEL OutcomesEnglish language arts/literacy NOTE: Numbers may not sum to 100% due to rounding.
2015 English Language arts literacy percentage(%) of Students meeting and exceeding expectations
2015 English Language arts literacy percentage(%) of Students meeting and exceeding expectations
2015 English Language arts literacy percentage(%) of Students meeting and exceeding expectations
2015 English Language arts literacy percentage(%) of Students meeting and exceeding expectations
2015 Parcc consortium grade-level Outcomes Mathematics Note: Numbers may not sum to 100% due to rounding.
2015 New Jersey PARCC grade-level Outcomes Mathematics * Note: Approximately 30,000 New Jersey students participated in the PARCC Algebra I assessment while in middle school. Thus, PARCC Math 8 outcomes are not representative of grade 8 performance as a whole. Note: Numbers may not sum to 100% due to rounding.
2015 Montgomery township school District PARCC GRADE-LEVEL Outcomesmathematics * Note: Approximately 36% of 7th grade students participated in either an Algebra I or Geometry PARCC assessment. Thus, PARCC Math 7 outcomes are not representative of grade 7 performance as a whole. Approximately 70% of 8th grade students participated in either an Algebra I, Geometry, or Algebra II PARCC assessment. Thus, PARCC Math 8 outcomes are not representative of grade 8 performance as a whole. NOTE: Numbers may not sum to 100%due to rounding.
2015 Mathematics percentage(%) of students meeting and exceeding expectations
2015 Mathematics percentage(%) of students meeting and exceeding expectations
2015 Mathematicspercentage(%) of students meeting and exceeding expectations
2015 Mathematicspercentage(%) of students meeting and exceeding expectations
Questions to Guide PARCC Data Reflection • How will we use PARCC data to identify strengths and gaps that exist in curriculum and instruction? • How will we use PARCC data to inform the conversations of our educators? • What can we learn about where additional professional resources are needed to meet the learning needs of all students?
Resources for Parents http://understandthescore.org/
Video: Understanding the score report http://understandthescore.org/
Parent Guide to the Score Reports http://www.parcconline.org/resources/educator-resources
How to help your child http://understandthescore.org/
Additional resources for parents http://understandthescore.org/