Download
1 / 4
40 likes | 209 Views
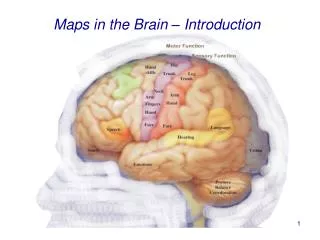
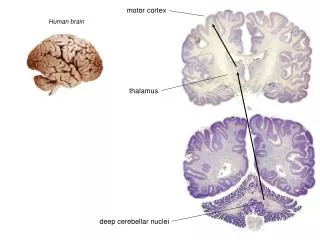
Cortical temporal maps in human brain. Domenica Bueti, Emiliano Macaluso, Vincent Walsh & Ryota Kanai. The question. Are different temporal intervals represented by the same or distinct neural substrates? test the existence of temporal maps ( chronomaps ) in the human brain.

E N D
Cortical temporal maps in human brain Domenica Bueti, Emiliano Macaluso, Vincent Walsh & Ryota Kanai
The question Are different temporal intervals represented by the same or distinct neural substrates? • test the existence of temporal maps (chronomaps) in the human brain. This idea is suggested by theoretical models (Buhusi and Meck, 2005, Ivry and Richardson, 2002 ) and supported by behavioural data (Wright et al., 1997, Pardo & Merchant in press).
(S = 200ms) (S = 200ms) (S = 400ms) (S = 400ms) (S = 600ms) Paradigm sequence of orientation changes: leftward → rightward → vertical. Within the base orientation the gabor continuously changes (range of changes 40° to 70°) S is the standard duration (7 standards- range 200 to 1400 ms in step of 200ms) C is the comparison duration = 1 ± Weber fraction (0.4)* standard Two response keys: T: which stimulus was longer? O: which stimulus had the biggest orientation change? Time 2 tasks: temporal discrimination (T) & orientation discrimination (O) which will be tested in separate runs Leftward Rightward Vertical S C ITI (500ms) Timeline of a single run S S C C S C S C S C 1s To S =1400 ms ... … 1 ‘ascending’ cycle (from S 200 to S 1400 ms) = 1.43 min ICI ‘ascending’ cycle 8 cycles per run = ~11.44 min; separate runs for ascendingand descending cycles 1 run = 12 minutes; 4 runs (2T 2O) = 48 minutes + 1 of run of visual localizer Standard EPI - 26 slices -TR=2.0 s
fMRI analysis and predictions Analysis of the visual localizer data : conventional meridian mapping method [Fourier analysis, segmentation and cortical flattening (Sereno et al., 1995)] Analysis of the tasks • Whole brain analysis: conventional SPM8 analysis to identify the ‘time network’. Prediction: T>O = visual areas, parietal cortex, SMA • Single subject analysis: Fourier transform on ROI data (ROI are defined using SPM results). Prediction: for T only,within each ROI a clear segregation between voxels activated preferentially by very long and very short intervals; less clear segregation for the intermediate intervals