Download
1 / 16
160 likes | 317 Views
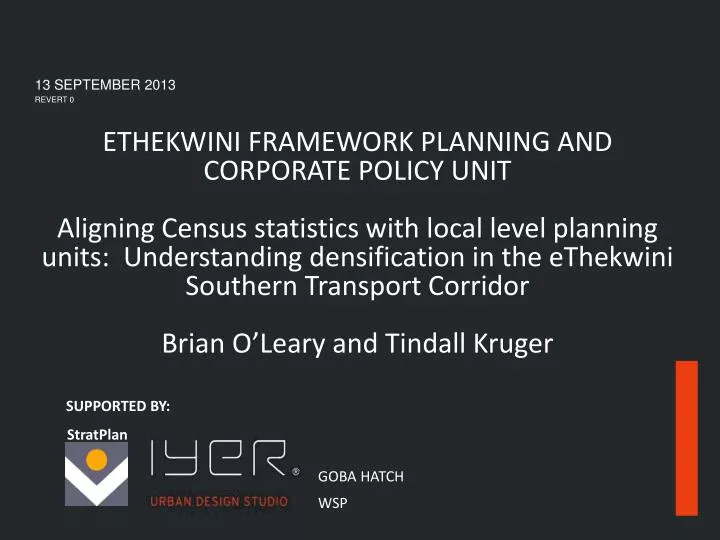
13 SEPTEMBER 2013 REVERT 0. ETHEKWINI FRAMEWORK PLANNING AND CORPORATE POLICY UNIT Aligning Census statistics with local level planning units: Understanding densification in the eThekwini Southern Transport Corridor Brian O’Leary and Tindall Kruger. SUPPORTED BY: GOBA HATCH WSP.

E N D
13 SEPTEMBER 2013REVERT 0 ETHEKWINI FRAMEWORK PLANNING AND CORPORATE POLICY UNIT Aligning Census statistics with local level planning units: Understanding densification in the eThekwini Southern Transport Corridor Brian O’Leary and Tindall Kruger • SUPPORTED BY: • GOBA HATCH • WSP StratPlan
INTRODUCTION 01 • In March 2013 StratPlan and Iyer Urban Design Studio were appointed by the eThekwini Framework Planning Branch to develop a densification framework for the Southern Public Transport Corridor • The Corridor represents a major portion of eThekwini, stretching from the Durban CBD to Isipingo and Umlazi, and remains a strategic corridor in eThekwini • A key challenge for this initiative was the availability of relevant and up to date information. On initiation of the project Census 2011 data was only available on the Ward level. Ward demarcation could not inform corridor level planning. • With this in mind the Corporate Policy Unit aligned Census 2011 Statistics on a “planning unit level” which made it possible for the planning team of the Framework Planning Branch to develop a much better understanding of the status quo and trends in the Corridor between 2001 and 2011.
INTRODUCTION - THE CORRIDOR 01 The corridor covers a complex urban environment and developing a good understanding of the current situation and future anticipated trends were therefore essential. Access to relevant statistics was therefore needed. The alignment of the census statistics with planning unit boundaries done by the eThekwini Corporate Policy Unit provideda tool for this analysis. BEREA STATION CONGELLA CLAIRWOOD UMLAZI STATION REUNION STATION ISIPINGO
BACKGROUND - A COMPLEX CORRIDOR 02 A NODAL ASSESSMENT Various income groups are already accommodated in the corridor with housing types ranging from the informal to the formal high income market. Densification responses within these housing areas will be differ. In engagements with commuters it was established that use is generally made of rail for transport purposes in those areas that rail can be easily accessed. In most areas the majority of commuters interviewed had a positive attitude towards higher density living if the advantages relating thereto is considered.
BACKGROUND – A STRATEGIC CORRIDOR 06 THE DEVELOPMENT DRIVERS BACK-OF-PORT A number of major and notable impacts will alter conditions with the Southern Public Transport Corridor significantly over the next two decades. These can be referred to as the future drivers of development and are located both external to the corridor and within the corridor area as demarcated for the purposes of this study. The key drivers are: • External drivers: Development of the Port of Durban; Development of the Dig-Out Port; Improved logistics infrastructure in terms of SIP and other initiatives; and rural urban migration. • Internal drivers: eThekwini (and Corridor) Population Growth; eThekwini Integrated Rapid Public Transport Network; PRASA station redevelopment; Development of Town Centres and Commercial Nodes; Back-of-Port Zone Planning and Development; Housing development processes. IRPTN ROUTE DIG-OUT PORT
ALIGNING CENSUS STATISTICS WITH LOCAL LEVEL PLANNING UNITS The Problem 02 Each new Census has differing main and sub-place boundaries when compared to the previous Census. In this map the red boundaries are Census 2011 and the grey boundaries are 2001. This creates a challenge when attempting to undertake local area trend analysis when the spatial boundaries are not consistent. Lamontville Bluff
02 ALIGNING CENSUS STATISTICS WITH LOCAL LEVEL PLANNING UNITS The Solution eThekwini Municipality has undertaken the following to resolve this problem: Develop consistent local area boundaries (Planning Units) 2) Develop a GIS application that can intersect the SSA sub places with the Planning Units and then dissolve the intersects so that Census data is aligned to the Planning Units. This application calculates numeric attributes using the ratio of area overlap between source data and the partitioner layer.
PLANNING UNIT STATS PROVIDED: QUICK OVERVIEW OF CORRIDOR 03 DEMOGRAPHICS SUB-CORRIDOR 2011 AGE DISTRIBUTION FAST FACTS: 32 PLANNING UNITS LINKED - 426 654 PEOPLE 12.4% OF ETHEKWINI POPULATION 50/50 GENDER SPLIT 70% BELOW 35 YEARS (20% BELOW 14) 66% EARNS < THAN R3 200 PER MONTH UNEMPLOYMENT IN SUB-CORRIDORS: • 15% UmbiloCongella • 20% Isipingo • 24% ClairwoodMerebank • 41% Umlazi IMPLICATIONS: A large proportion of the eThekwini population is accommodated within the corridor. The population is generally young, and a high level of unemployment exists. Future interventions in the corridor should focus on both job creation and residential development. Source: Census 2011
03 PLANNING UNIT STATS PROVIDED: AREA SPECIFIC INFORMATION BEREA STATION UNEMPLOYMENT – SELECTED AREAS EMPLOYMENT UNEMPLOYMENT IN THE CORRIDOR AS A WHOLE IMPROVED FROM 45% IN 2001 TO 28% IN 2011 UNEMPLOYMENT IN THE SUB-CORRIDORS: • UmbiloCongella – 15% unemployed; • ClairwoodMerebank – 24% unemployed; • Isipingo – 20% unemployed; and • Umlazi – 41% unemployed. CONGELLA CBD 17% GLENWOOD 5% CLAIRWOOD MONTCLAIR 12% UMLAZI STATION LAMONTVILLE 41% IMPLICATIONS – EMPLOYMENT: Even though unemployment levels have significantly improved in the corridor over the past decade some areas still experience unemployment levels of close to 50%. Economic development and job creation in the corridor must remain priorities in the future development of the corridor as new residential development will not be sustainable if people are unable to afford it. REUNION STATION UMLAZI H 47% ISIPINGO UMLAZI L 47% UMLAZI S 41%
03 PLANNING UNIT STATS PROVIDED: AREA SPECIFIC INFORMATION IMPLICATIONS: HOUSING TYPES Although there appears to be a decline in the population residing in backyard and informal dwellings between 2001 and 2011, a large 40% of Umlazi residents relating to the Corridor, was still accommodated in this type of housing in 2011. In Umlazi S the percentage is as high as 71%. The current housing backlog is therefore still massive. The high 64% of residents in the Umbilo Congella Sub-Corridor already living in higher density housing is noted. In some planning units more than 80% of the population reside in higher density housing. It is anticipated that opportunities for densification in these areas may be limited. In some nodes such as Jacobs and Mobeni the high percentage in higher density accommodation relates to hostels in the area. In planning for densification valuable lessons may be learnt from recent hostel redevelopments. HOUSING TYPES 2011 HOUSING TYPES IN SUB-CORRIDORS Source: Census 2011
03 PLANNING UNIT STATS PROVIDED: AN UNDERSTANDING OF KEY TRENDS POPULATION GROWTH P.A. – 2011 to 2011 BEREA STATION CBD + 3.6% POPULATION GROWTH POPULATION GROWTH RATE 2001- 2011 = 1% P.A. IN LINE WITH SA NATURAL POPULATION GROWTH VARIATIONS IN TERMS OF SUB-CORRIDORS: • UmbiloCongella – 1.9% p.a • ClairwoodMerebank – 0.7% p.a. • Isipingo – 1% p.a. • Umlazi – 0.9% p.a. IN MOST AREAS CHANGES IN HOUSING STOCK LIMITED GLENWOOD - 0.1% CONGELLA CLAIRWOOD MONTCLAIR + 3.9% CLAIRWOOD - 3.1% LAMONTVILLE + 0.9% UMLAZI STATION UMLAZI D -0.8% REUNION STATION UMLAZI Q + 3% UMLAZI S + 4.1% ISIPINGO
03 PLANNING UNIT STATS PROVIDED: HIGHLIGTED SPECIFIC TRENDS POPULATION GROWTH IMPLICATIONS: HISTORIC GROWTH Densification has occurred in the corridor over the past decade without the addition of substantial new housing stock. Population numbers in some middle to high income areas declined whereas an area such as Montclair experienced substantial growth. A number of units in Umlazi, despite already high densities, has experienced rapid growth. It is anticipated that as capacity is reached in certain planning units the pressure for accommodation will increase in other areas within the corridor. Clairwood appears to be experiencing a rapid decline in population despite its good location in terms of access to job opportunities.
03 PLANNING UNIT STATS PROVIDED: HIGHLIGTED SPECIFIC TRENDS IMPLICATIONS: CURRENT DENSITIES The overall nett density in the areas linked to the corridor, based on 4 people per household, is 24 households per hectare. This range from high densities of between 50 to 60 households per hectare in portions of the CBD and the majority of Umlazi Planning Units. The already high densities suggest a range of challenges in identifying further opportunities for densification. The only areas where household densities are low are the middle to high income residential areas such as Umbilo, Glenwood, Isipingo, Sea View and others. High land values and zoning will present a challenge for densification in these areas.
03 PLANNING UNIT STATS PROVIDED: PROVIDED THE BASE FOR FUTURE PROJECTIONS • FUTURE GROWTH • Considering historic growth rates it is assumed that household growth in the corridor will continue. • The rate of growth will depend on a range of factors, but economic development will be a key determinant. Three scenarios are considered and household growth rates linked: • Low road - 1% p.a. (current); • Middle road 2% p.a. (some economic growth); and • High road 3% p.a. (Dig-out Port). • In the High Road Scenario more than 100 000 additional households will have to be accommodated in the corridor over the next 20 years. • In Low Road Scenario this will be • 25 000 households.
CONCLUDING COMMENTS 04 Being able to access Census data on an appropriate level of detail and at regular time intervals is essential for effective evidence based planning. In the case of the Southern Transport Corridor Densification Study access to planning unit level information provided an excellent starting point for better understanding the status quo and key trends on which future planning will be based. The use of planning unit information for all strategic spatial planning in eThekwini should continue to be encouraged.