Download
1 / 12
120 likes | 258 Views
Top 10 Next Wave Cities. Source: BPAP-CICT-DTI Next Wave Cities Scorecard. 1. 2007 IT- BPO FTEs by Type. Contact centers, the most dominant sector. The non-voice BPOs as software, animation and transcription had FTEs less than 100. 4%. 4%. 6%. Contact Center 86%. 2007 Total FTEs at 1171.

E N D
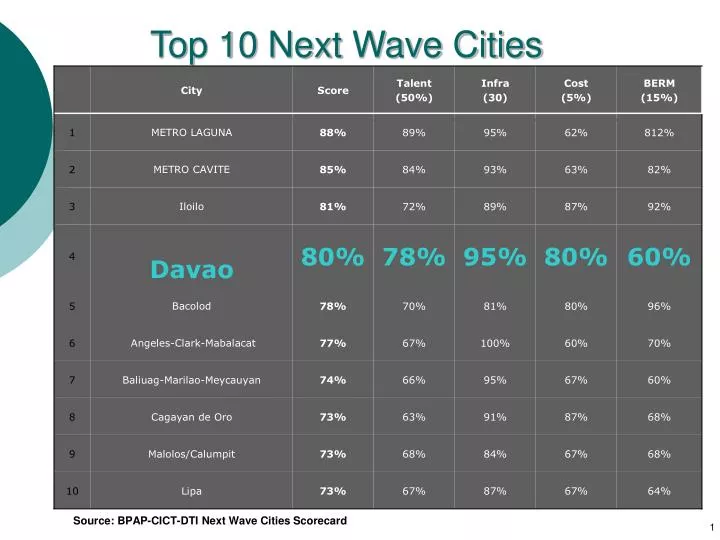
Top 10 Next Wave Cities Source: BPAP-CICT-DTI Next Wave Cities Scorecard 1
2007 IT- BPO FTEs by Type Contact centers, the most dominant sector. The non-voice BPOs as software, animation and transcription had FTEs less than 100. 4% 4% 6% Contact Center 86% 2007 Total FTEs at 1171
Contact Center sector The fastest growing sector in the city • Contact Centers : 15 • Contact Centers in Phils: 124 • Total Full Time Employees end 2009: 5,555 • Total FTEs Phils: 198,000 • Past 2 years annual employment growth: 144% Key Players : AMS Solutions, Call Box, Concentrix, CyberCityTeleservices, NBSI, Sutherland,Western Wats,
Contact Center Growth in FTEs One of the fastest growing sector in the city 76% 78% +200%
Data Entry and Transcription- Medical/Legal/General No. of Service Providers: 8 Total Phil Companies: 122 Total FTEs: 175 Total Phil FTEs: 57,000 Past 2 years annual employment growth: 66% Key Players : AACT Scribemasters, HubPort, Reliance, SSP Transcriptions, Synergy, Transcript King, ZipIT Solutions
Software, Graphics and Content Development Software Development Companies: 17 SW Companies Phils: 120 Total Estimated Full Time Employees: 150 Total Phil FTEs: 29,188 Key Players: Lane Systems, Hubport, Ithink, Mynd Consulting, ECPAC, Digilutions, Mega Bytes and Bites, APEX, AFIS
Animation & Gaming Total animation providers: 3 Total animation Phils: 70 Total Employees: 50 Total Phil FTEs: 7,000 Capabilities: - 2D - 3D Key Players in the Country: Cube Pixels, Eversun
Engineering & Design Process Total Number of Companies: 3 Total Phil Companies: 24 Total Number of Full Time Employees: 300-500 Total Phil FTEs: 8,000 Key Players: Nakayama, Far East Associates, Meno-Gaia Phils
2010 IT- BPO FTEs by Type 3% Transcription Software 4% 4% Animation 6% Engineering & Design Contact Center 84% In 2010, the contact centers will continue to be the most dominant form of BPO service. The non-voice will experience steady double digit growth in number of FTEs
Non-Voice FTEs 2007- 2010 All non-voice segments will experience rapid growth AGR 66% AGR 40% AGR 49% AGR 60% SWD E&D
ICT Development Plan 2015 Where are we now? Where do we want to go? How do we get there? How do we know when we get there? • Where are we now? • Scorecard Assessment • Where do we want to go? • Jobs: how many, where, what kind? • How do we get there? • Strategic Action Plans • How do we know when we get there? • Performance Measures and Milestones
Key messages • O&O is a large and growing industry with Davao City among the top 4 players today • Unparalleled opportunity to grow Davao’s share from 1% of the Philippine market in 2008 to 5% by 2015 • From 6000 direct jobs to 30,000 jobs by 2010 • Our ICT development plan shall focus on addressing the gaps in talent development, infrastructure development, cost of doing business and business enironment. 12