Download
1 / 2
20 likes | 29 Views
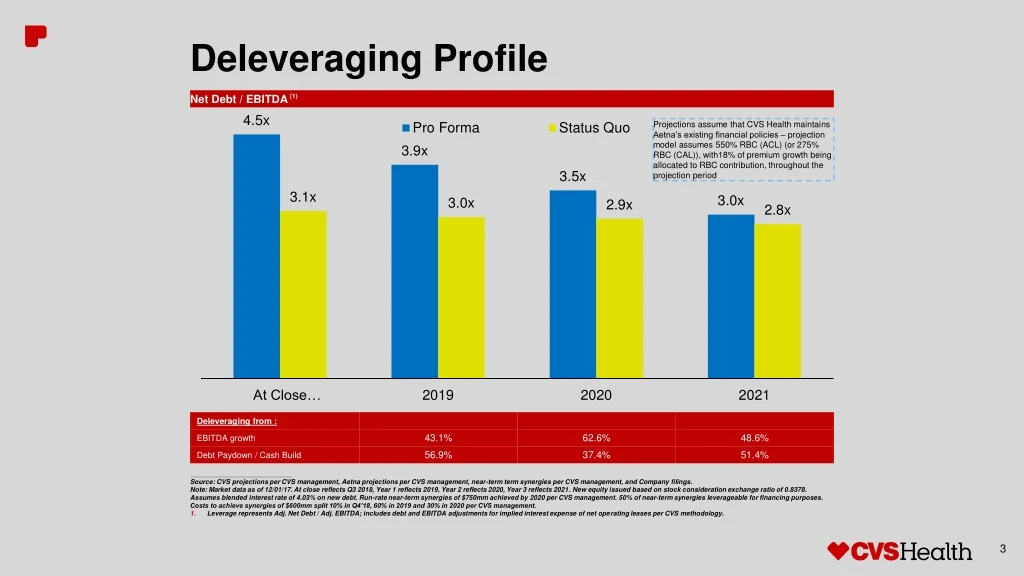
Deleveraging Profile. Net Debt / EBITDA (1). ___________________________ Source: CVS projections per CVS management, Aetna projections per CVS management, near-term term synergies per CVS management, and Company filings.

E N D
Deleveraging Profile Net Debt / EBITDA (1) ___________________________ Source: CVS projections per CVS management, Aetna projections per CVS management, near-term term synergies per CVS management, and Company filings. Note: Market data as of 12/01/17. At close reflects Q3 2018, Year 1 reflects 2019, Year 2 reflects 2020, Year 3 reflects 2021. New equity issued based on stock consideration exchange ratio of 0.8378. Assumes blended interest rate of 4.03% on new debt. Run-rate near-term synergies of $750mm achieved by 2020 per CVS management. 50% of near-term synergies leverageable for financing purposes. Costs to achieve synergies of $600mm split 10% in Q4’18, 60% in 2019 and 30% in 2020 per CVS management. Leverage represents Adj. Net Debt / Adj. EBITDA; includes debt and EBITDA adjustments for implied interest expense of net operating leases per CVS methodology. Projections assume that CVS Health maintains Aetna’s existing financial policies – projection model assumes 550% RBC (ACL) (or 275% RBC (CAL)), with18% of premium growth being allocated to RBC contribution, throughout the projection period
Deleveraging Profile Net Debt / EBITDA (1) ___________________________ Source: CVS projections per CVS management, Aetna projections per CVS management, near-term term synergies per CVS management, and Company filings. Note: Market data as of 12/01/17. At close reflects Q3 2018, Year 1 reflects 2019, Year 2 reflects 2020, Year 3 reflects 2021. New equity issued based on stock consideration exchange ratio of 0.8378. Assumes blended interest rate of 4.03% on new debt. Run-rate near-term synergies of $750mm achieved by 2020 per CVS management. 50% of near-term synergies leverageable for financing purposes. Costs to achieve synergies of $600mm split 10% in Q4’18, 60% in 2019 and 30% in 2020 per CVS management. Leverage represents Adj. Net Debt / Adj. EBITDA; includes debt and EBITDA adjustments for implied interest expense of net operating leases per CVS methodology. Projections assume that CVS Health maintains Aetna’s existing financial policies – projection model assumes 550% RBC (ACL) (or 275% RBC (CAL)), with18% of premium growth being allocated to RBC contribution, throughout the projection period