Download
1 / 14
140 likes | 280 Views
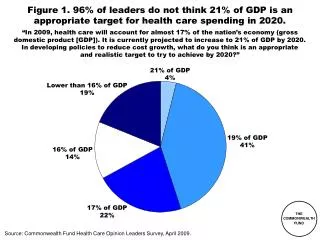
Driving Competition, Efficiencies and Innovative Practices Throughout the Health Care System: A Public Health Insurance Plan. Karen Davis President, The Commonwealth Fund Alliance for Health Reform Briefing April 27, 2009 kd@cmwf.org www.commonwealthfund.org.

E N D
Driving Competition, Efficiencies and Innovative Practices Throughout the Health Care System: A Public Health Insurance Plan Karen Davis President, The Commonwealth Fund Alliance for Health Reform Briefing April 27, 2009 kd@cmwf.org www.commonwealthfund.org
Affordable Coverage for All: Policies In Path Report • Builds on employer coverage and public programs • New national insurance exchange • Offers private plans and new public health insurance plan • Pools risk and reduces administrative costs, easy enrollment • All required to have coverage, with provisions for affordability • Low income programs expanded • Income-related premium assistance to make coverage affordable • Shared responsibility for financing: all employers contribute • Insurance market reforms • Minimum national benefit standard • Guaranteed issue, renewal & community rating • Provider payment reforms in public plan, Medicare, and Medicaid • Reward primary care; blended medical home fees and FFS • Bundle hospital payment and post-acute care • Slow cost growth over time and share savings with providers • Insurers compete on basis of added value Source: The Path to a High Performance U.S. Health System, Commonwealth Fund Feb. 2009.
Transforming Markets: Potential of an Insurance Exchange with a Public Health Insurance Option • Exchange with Insurance Market Reforms • Enables continuity and choice: access to regional plans • Transparency: easy to compare and enroll; benchmarks • Reduces administrative costs: marketing, underwriting, churning • Public Health Insurance Plan • Broadens foundation for rapid implementation of innovative payment and system reforms and slows growth in employer premiums • Provides less expensive way to cover the uninsured; lower administrative costs; lower federal budget cost • Expands choice/continuity with secure option nation-wide that will always be there • Ensures markets work in the public interest: counterbalance to market power by insurers or providers
NH ME WA VT ND MT MN OR MA NY WI SD ID RI MI WY CT PA NJ IA OH NE DE NV IN IL MD WV UT VA DC CO CA MO KS KY NC TN OK SC AR AZ NM GA MS AL LA TX FL 80%–100% 70%–79% 50%–69% Less than 50% Market Share of Two Largest Health Plans, by State, 2006 AK HI Note: Market shares are for the combined HMO+PPO product market. For MS and PA, shading represents shares of top three insurers in 2002-2003. Source: American Medical Association, Competition in health insurance: A comprehensive study of U.S. markets, 2008 update, ; J. Robinson, “Consolidation and the Transformation of Competition in Health Insurance,” Health Affairs, November/December 2004; D. McCarthy et al., “The North Dakota Experience: Achieving High-Performance Health Care Through Rural Innovation and Cooperation,” The Commonwealth Fund, May 2008.
Benefit Design for Public Health Insurance PlanOffered in Insurance Exchange * Basic benefits before Medigap. ** Part D coverage varies, often deductible. Most have “doughnut” hole and use tiered, flat-dollar copayments. Note: Benefit design also would apply to Medicare Extra supplement option available to Medicare beneficiaries. Source: Commonwealth Fund Commission on a High Performance Health System, The Path to a High Performance U.S. Health System: A 2020 Vision and the Policies to Pave the Way, Commonwealth Fund, February 2009.
Cost of Administering Health Insurance as a Percent of Claims, Current Law Compared to Insurance Exchange with Reforms, by Group Size Percentage Data: Estimates by The Lewin Group for The Commonwealth Fund. Source: Commonwealth Fund Commission on a High Performance Health System, The Path to a High Performance U.S. Health System: A 2020 Vision and the Policies to Pave the Way, February 2009.
Net Insurance/Program Administrative Cost as a Percent of Total Spending, Various U.S. Insurance Markets Percent of claims *Average for firms with 2 to 49 employees **Top five companies based on 2008 corporate financial reports and filings. Computed based on medical loss ratio ***Medicare includes administrative costs of Part D private plans. Medicaid includes eligibility determination. Source: M. Hartman et al. “National Health Spending in 2007” Health Affairs for national, Medicaid and Medicare. Lewin group for market segments of private. SEC filings and corporate reports for top 5 private plans.
Estimated Premiums for New Public PlanCompared with Average Individual/Small Employer Private Market, 2010 Average annual premium for equivalent benefits at community rate* Public plan with private payment rates saves 9%; public plan with Medicare payment rates and system reform saves 17-30% relative to current small firm premiums. * Adjusted for Path benefits and average enrollees. Benefits used for modeling include full scope of acute care medical benefits; $250 individual/$500 family deductible; 10% coinsurance for physician service; 25% coinsurance and no deductible for prescription drugs; reduced for high-value medications; full coverage checkups/preventive care. $5,000 individual/$7,000 family out-of-pocket limit. Data: Estimates by The Lewin Group for The Commonwealth Fund.
Three Insurance Exchange Scenarios:Cumulative 11-Year Savings in National Health Expenditures, 2010–2020 Cumulative National Health Expenditures Savings compared with baseline (trillions) Data: Estimates by The Lewin Group for The Commonwealth Fund. Source: Commonwealth Fund Commission on a High Performance Health System, The Path to a High Performance U.S. Health System: A 2020 Vision and the Policies to Pave the Way, Commonwealth Fund, February 2009.
Path Net Cumulative Impact on National Health Expenditures(NHE) 2010–2020 Compared with Baseline,With and Without Public Health Insurance Plan, by Major Payer Groups Dollars in billions Note: A negative number indicates spending decreases compared with projected expenditures (i.e., savings); a positive indicates spending increases. Data: Estimates by The Lewin Group for The Commonwealth Fund. Source: The Commonwealth Fund Commission on a High Performance Health System, The Path to a High Performance U.S. Health System: A 2020 Vision and the Policies to Pave the Way, (New York: The Commonwealth Fund, February 2009).
Total National Health Expenditures (NHE), 2010–2020Current Projection and Alternative Scenarios NHE in trillions 6.7% annual growth $5.2 $5.0 $4.6 5.5% annual growth 6.1% annual growth $2.7 Note: GDP = Gross Domestic Product. Data: Estimates by The Lewin Group for The Commonwealth Fund. Source: The Commonwealth Fund Commission on a High Performance Health System, The Path to a High Performance U.S. Health System: A 2020 Vision and the Policies to Pave the Way, (New York: The Commonwealth Fund, February 2009).
Total National Health Expenditure Growth for Hospitals and Physicians, Current Projections and with Policy Changes, 2009–2020 Hospital Expenditures (trillions) Physician Expenditures (trillions) $1.6 $1.4 $1.3 $1.1 $0.8 $0.7 Data: Estimates by The Lewin Group for The Commonwealth Fund. Source: The Lewin Group, The Path to a High Performance U.S. Health System: Technical Documentation (Washington, D.C.: The Lewin Group, 2009).
Implications for Stakeholders of Path • Coverage and Savings • Coverage for all with $3.0 trillion system savings 2010-2020 with public health insurance plan; $0.8 trillion without • Coverage for all with $593 billion federal budget cost 2010-2020 with a public health insurance plan; $1.112 trillion without • Employers and Employees • Public health insurance plan more affordable than premiums now in small business market: 20-30% lower premiums • Savings to employers including payment and system reforms of $231 billion over 2010-2020 • Providers • Provider revenues enhanced by increasing Medicaid payment to Medicare levels and buying in uninsured at Medicare rates • Payment reforms reward primary care and high performers but slower revenue growth over time than current law • Insurers • Rewards integrated delivery system and private insurers that enhance value • Administrative savings of $337 billion over 2010-2020
Thank You! Stephen C. Schoenbaum, M.D., Executive Vice President and Executive Director, Commission on a High Performance Health System, scs@cmwf.org Stu Guterman, Assistant Vice President, sxg@cmwf.org Rachel Nuzum, Senior Policy Director rn@cmwf.org Cathy Schoen, Senior Vice President for Research and Evaluation, cs@cmwf.org Sara Collins, Assistant Vice President, src@cmwf.org Kristof Stremikis, Research Associate, ks@cmwf.org For more information, please visit: www.commonwealthfund.org