Download

1 / 52
520 likes | 617 Views
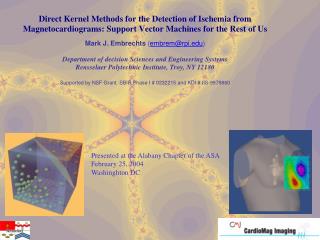
Presented at the Alabany Chapter of the ASA February 25, 2004 Washinghton DC. Magnetocardiography at CardioMag Imaging inc. With Bolek Szymanski and Karsten Sternickel. Left: Filtered and averaged temporal MCG traces for one cardiac cycle in 36 channels (the 6x6 grid).

E N D
Presented at the Alabany Chapter of the ASA February 25, 2004 Washinghton DC
Magnetocardiography at CardioMag Imaging inc. With Bolek Szymanski and Karsten Sternickel
Left: Filtered and averaged temporal MCG traces for one cardiac cycle in 36 channels (the 6x6 grid). Right Upper: Spatial map of the cardiac magnetic field, generated at an instant within the ST interval. Right Lower: T3-T4 sub-cycle in one MCG signal trace
Prediction model Classical (Linear) Regression Analysis: Predict y from X Can we apply wisdom to data and forecast them right? Xnm (n = 19 & m = 7) 19 data and 7 attributes Pseudo inverse y (1 response)
Fundamental Machine Learning Paradox • Learning occurs because of redundancy (patterns) in the data • Machine Learning Paradox: If data contain redundancies • (i) we can learn from data • (ii) the “feature kernel matrix” KF is ill-conditioned • How to resolve Machine Learning Paradox? (i) fix rank deficiency of KF with principal components (PCA) (ii) regularization: use KF+I instead of KF (ridge regression) (iii) local learning
Principal Component Regression (PCR): Replace Xnm by Tnh Tnh principal components projection of the (n) data records on the (h) “most important” eigenvectors of the feature kernel KF
Ridge Regression in Data Space • “Wisdom” is now obtained from the right-hand inverse or Penrose inverse Ridge term is added to resolve learning paradox Needs kernels only Data Kernel KD
Implementing Direct Kernel Methods Linear Model: - PCA model - PLS model - Ridge Regression - Self-Organizing Map . . .
xi xj What have we learned so far? • There is a “learning paradox” because of redundancies in the data • We resolved this paradox by “regularization” • - In the case of PCA we used theeigenvectors of the feature kernel • - In the case of ridge regression weadded a ridge to the data kernel • So far prediction models involved only linear algebra stricly linear • What is in a kernel? The data kernel containslinearsimilarity measures (correlations) of data records
xi xj Kernels Nonlinear • What is a kernel? • - The data kernel expresses a similarity measure between data records • - So far, the kernel contains linear similarity measures linear kernel • We actually can make up nonlinear similarity measures as well Distance or difference Radial Basis Function Kernel
Review: What is in a Kernel? • A kernel can be considered as a (nonlinear) data transformation • - Many different choices for the kernel are possible • - The Radial Basis Function (RBF) or Gaussian kernel is an effective nonlinear kernel • The RBF or Gaussian kernel is a symmetric matrix • - Entries reflect nonlinear similarities amongst data descriptions • - As defined by:
Direct Kernel Methods for Nonlinear Regression/Classification • Consider the Kernel as a (nonlinear) data transformation • - This is the so-called “kernel trick” (Hilbert, early 1900’s) • - The Radial Basis Function (RBF) or Gaussian kernel is an efficient nonlinear kernel • Linear regression models can be “tricked” into nonlinear models by applying • such regression models on kernel transformed data • - PCA DK-PCA • - PLS DK-PLS (Partial Least Squares Support Vector Machines) • - (Direct) Kernel Ridge Regression Least Squares Support Vector Machines • - Direct Kernel Self-Organizing maps (DK-SOM) • These methods work in the same space as SVMs • - DK models can usually be derived also from an optimization formulation (similar to SVMs) • - Unlike the original SVMs DK methods are not sparse (i.,e., all data are support vectors) • - Unlike SVMs there is no patent on direct kernel methods • - Performance on hunderds of benchmark problems compare favorably with SVMs • Classification can be considered as a special cae of regression • Data Pre-processing: Data are usually Mahalanobis scaled first
Nonlinear PCA in Kernel Space • Like PCA • Consider a nonlinear data kernel transformation up front: Data Kernel • Derive principal components for that kernel (e.g. with NIPALS) • Examples: - Haykin’s Spiral • - Cherkassky’s nonlinear function model
PCA Example: Haykin’s Spiral (demo: haykin1) PCA
Linear PCR Example: Haykin’s Spiral (demo: haykin2)
K-PCR Example: Haykin’s Spiral 3 PCAs 12 PCAs (demo: haykin3)
Scaling, centering & making the test kernel centering consistent Centered Direct Kernel (Training Data) Training Data Mahalanobis-scaled Training Data Kernel Transformed Training Data Mahalanobis Scaling Factors Vertical Kernel Centering Factors Centered Direct Kernel (Test Data) Test Data Mahalanobis-scaled Test Data Kernel Transformed Test Data
36 MCG T3-T4 Traces • Preprocessing: • horizontal Mahalanobis scaling • D4 wavlet transform • vertical Mahalanobis scaling • (features and response)
SVMLib Linear PCA SVMLib Direct Kernel PLS
Direct Kernel with Robert Bress and Thanakorn Naenna
www.drugmining.com Kristin Bennett and Mark Embrechts
Docking Ligands is a Nonlinear Problem DDASSL Drug Design and Semi-Supervised Learning
WORK IN PROGRESS GATCAATGAGGTGGACACCAGAGGCGGGGACTTGTAAATAACACTGGGCTGTAGGAGTGA TGGGGTTCACCTCTAATTCTAAGATGGCTAGATAATGCATCTTTCAGGGTTGTGCTTCTA TCTAGAAGGTAGAGCTGTGGTCGTTCAATAAAAGTCCTCAAGAGGTTGGTTAATACGCAT GTTTAATAGTACAGTATGGTGACTATAGTCAACAATAATTTATTGTACATTTTTAAATAG CTAGAAGAAAAGCATTGGGAAGTTTCCAACATGAAGAAAAGATAAATGGTCAAGGGAATG GATATCCTAATTACCCTGATTTGATCATTATGCATTATATACATGAATCAAAATATCACA CATACCTTCAAACTATGTACAAATATTATATACCAATAAAAAATCATCATCATCATCTCC ATCATCACCACCCTCCTCCTCATCACCACCAGCATCACCACCATCATCACCACCACCATC ATCACCACCACCACTGCCATCATCATCACCACCACTGTGCCATCATCATCACCACCACTG TCATTATCACCACCACCATCATCACCAACACCACTGCCATCGTCATCACCACCACTGTCA TTATCACCACCACCATCACCAACATCACCACCACCATTATCACCACCATCAACACCACCA CCCCCATCATCATCATCACTACTACCATCATTACCAGCACCACCACCACTATCACCACCA CCACCACAATCACCATCACCACTATCATCAACATCATCACTACCACCATCACCAACACCA CCATCATTATCACCACCACCACCATCACCAACATCACCACCATCATCATCACCACCATCA CCAAGACCATCATCATCACCATCACCACCAACATCACCACCATCACCAACACCACCATCA CCACCACCACCACCATCATCACCACCACCACCATCATCATCACCACCACCGCCATCATCA TCGCCACCACCATGACCACCACCATCACAACCATCACCACCATCACAACCACCATCATCA CTATCGCTATCACCACCATCACCATTACCACCACCATTACTACAACCATGACCATCACCA CCATCACCACCACCATCACAACGATCACCATCACAGCCACCATCATCACCACCACCACCA CCACCATCACCATCAAACCATCGGCATTATTATTTTTTTAGAATTTTGTTGGGATTCAGT ATCTGCCAAGATACCCATTCTTAAAACATGAAAAAGCAGCTGACCCTCCTGTGGCCCCCT TTTTGGGCAGTCATTGCAGGACCTCATCCCCAAGCAGCAGCTCTGGTGGCATACAGGCAA CCCACCACCAAGGTAGAGGGTAATTGAGCAGAAAAGCCACTTCCTCCAGCAGTTCCCTGT GATCAATGAGGTGGACACCAGAGGCGGGGACTTGTAAATAACACTGGGCTGTAGGAGTGA TGGGGTTCACCTCTAATTCTAAGATGGCTAGATAATGCATCTTTCAGGGTTGTGCTTCTA TCTAGAAGGTAGAGCTGTGGTCGTTCAATAAAAGTCCTCAAGAGGTTGGTTAATACGCAT GTTTAATAGTACAGTATGGTGACTATAGTCAACAATAATTTATTGTACATTTTTAAATAG CTAGAAGAAAAGCATTGGGAAGTTTCCAACATGAAGAAAAGATAAATGGTCAAGGGAATG GATATCCTAATTACCCTGATTTGATCATTATGCATTATATACATGAATCAAAATATCACA CATACCTTCAAACTATGTACAAATATTATATACCAATAAAAAATCATCATCATCATCTCC ATCATCACCACCCTCCTCCTCATCACCACCAGCATCACCACCATCATCACCACCACCATC ATCACCACCACCACTGCCATCATCATCACCACCACTGTGCCATCATCATCACCACCACTG TCATTATCACCACCACCATCATCACCAACACCACTGCCATCGTCATCACCACCACTGTCA TTATCACCACCACCATCACCAACATCACCACCACCATTATCACCACCATCAACACCACCA CCCCCATCATCATCATCACTACTACCATCATTACCAGCACCACCACCACTATCACCACCA CCACCACAATCACCATCACCACTATCATCAACATCATCACTACCACCATCACCAACACCA CCATCATTATCACCACCACCACCATCACCAACATCACCACCATCATCATCACCACCATCA CCAAGACCATCATCATCACCATCACCACCAACATCACCACCATCACCAACACCACCATCA CCACCACCACCACCATCATCACCACCACCACCATCATCATCACCACCACCGCCATCATCA TCGCCACCACCATGACCACCACCATCACAACCATCACCACCATCACAACCACCATCATCA CTATCGCTATCACCACCATCACCATTACCACCACCATTACTACAACCATGACCATCACCA CCATCACCACCACCATCACAACGATCACCATCACAGCCACCATCATCACCACCACCACCA CCACCATCACCATCAAACCATCGGCATTATTATTTTTTTAGAATTTTGTTGGGATTCAGT ATCTGCCAAGATACCCATTCTTAAAACATGAAAAAGCAGCTGACCCTCCTGTGGCCCCCT TTTTGGGCAGTCATTGCAGGACCTCATCCCCAAGCAGCAGCTCTGGTGGCATACAGGCAA CCCACCACCAAGGTAGAGGGTAATTGAGCAGAAAAGCCACTTCCTCCAGCAGTTCCCTGT DDASSL Drug Design and Semi-Supervised Learning
t2 t1 x3 x1 y x2 Direct Kernel Partial-Least Squares (K-PLS) • Direct Kernel PLS is PLS with the kernel transform as a preprocessing step • Consider K-PLS as a “better” nonlinear PLS • Consider PLS as a “ better” PCA • K-PLS gives almost identical (but more stable) results as SVMs • - PLS is the method by choice for chemometrics and QSAR drug design • - hyper-parameters are easy to tune (5 latent variables) • - unlike SVMs there is no patent on K-PLS
xi xj What have we learned so far? • There is a “learning paradox” because of redundancies in the data • We resolved this paradox by “regularization” • - In the case of PCA we used theeigenvectors of the feature kernel • - In the case of ridge regression weadded a ridge to the data kernel • So far prediction models involved only linear algebra strictly linear • What is in a kernel? The data kernel containslinearsimilarity measures (correlations) of data records
xi xj Kernels Nonlinear • What is a kernel? • - The data kernel expresses a similarity measure between data records • - So far, the kernel contains linear similarity measures linear kernel • We actually can make up nonlinear similarity measures as well Distance or difference Radial Basis Function Kernel
PCR in Feature Space Means that the projections on the eigenvectors will be divided with the corresponding variance (cfr. Mahalanobis scaling) Σ Σ x1 This layer gives a weighted similarity score with each datapoint Σ Σ . . . Σ Σ Σ xi Kind of a nearest neighbor weighted prediction score Σ Σ xm Σ Weights correspond to the dependent variable for the entire training data Weights correspond to H eigenvectors corresponding to largest eigenvalues of XTX Σ Weights correspond to the scores or PCAs for the entire training set
PCR in Feature Space t1 x1 w1 Σ w2 y Σ Σ xi t2 wh Σ th xm • Principal components can be thought of • as a data pre-processing step • Rather than building a model for an • m-dimensional input vector x we now have • a h-dimensional t vector Weights correspond to H eigenvectors corresponding to largest eigenvalues of XTX
Predictions on Test Cases with DK-SOM Use of a direct kernel self-organizing map in testing mode for the detection of patients with ischemia (read patient IDs). The darker hexagons colored during a separate training phase represent nodes corresponding with ischemia cases.
Outlier Detection Procedure in Analyze start List of Outlier pattern IDs One-class SVM on training data Proprietory regularization mechanism Determine number of outliers from elbow plot Eliminate outliers from training set Run K-PLS for new training/test data See whether outliers make sense on pharmaplots Inspect outlier clusters on SOMs end Outliers are flagged in pharmaplots
“Elbow” Plot for Specifying # Outliers “Elbows” suggest 7-14 outliers
Outlier/Novelty Detection Methods in Analyze: Hypotheses • One-class SVMs are commonly cited for outlier detection (e.g., Suykens) • - used publicly available SVM code (LibSVM) • - Analyze has user-friendly interface operators for using LibSVM • Proprietary heuristic tuning for C in SVMs • - heuristic tuning method explained in previous publications • - heuristic tuning is essential to make outlier detection work properly • “Elbow” curves for indicating # outliers • Pharmaplot justifies/validates detection from different methods • Pharmaplots extended to PLS, K-PCA, and K-PLS pharmaplots
One-Class SVM: Brief Theory • Well-known method for outlier & novelty detection in SVM literature • (e.g., seeSuykens) • LibSVM, a publicly available SVM code for general use, has one-class • SVM option built-in (see Chih-Chung Chang and Chih-Jen Lin ) • Analyze has operators to interface with LibSVM • Theory: • - One-class SVM ignores response (assumes all zeros for responses) • - Maximizes spread and subtracts regularization term • - Suykens, pp. 203 has following formulation • - is a regularization parameter, Analyze has proprietary way to determine • Application: • - Analyze combines one-class SVMs with pharmaplots to see whether outliers • can be explained and make sense • - Analyze has elbow curves to assist user in determining # outliers • - Combination of 1-class SVMs with pharmaplots, gave excellent results on • several industrial (non-pharmaceutical) data
NIPALS ALGORITHM FOR PLS (with just one response variable y) • Start for a PLS component: • Calculate the score t: • Calculate c’: • Calculate the loading p: • Store t in T, store p in P, store w in W • Deflate the data matrix and the response variable: Do for h latent variables
Outlier/Novelty Detection Methods in Analyze • Outlier detection methods where extensively tested: • - on a variety of different UCI data sets • - models sometimes showed significant improvement after removal of outliers • - models were rarely worse • - outliers could be validated on pharmaplots and lead to enhanced insight • The pharmaplots confirm the validity of outlier detection with one-class SVM • Prediction on test set for albumin data improves model • A non-pharmaceutical (medical) data set actually shows two data points in the • training set that probably were given wrong labels (Appendix A)
R T S P Q
Innovations in Analyze for Outlier Detection • User-fiendly procedure with automated processes • Interface for one-class SVM from LibSVM • Automated tuning for regularization parameters • Elbow plots to determine number of outliers • Combination of LibSVM outliers with pharmaplots • - efficient visualization of outliers • - facilitates interpretation of outliers • Extended pharmaplots • - PCA • - K-PCA • - PLS • - K-PLS • User-friendly and efficient SOM with outlier identification • Direct-Kernel-based outlier detection as an alternative to LibSVM
Principal Component Analysis (PCA) • We introduce a modest set of h most important principal components, Tnh • Replace data Xnm by most important principal components Tnh • The most important T’s are the ones corresponding to largest eigenvalues of XTX • The B’s are the eigenvectors of XTX ordered from largest to lowest eigenvalue • In practice calculation of B’s and T’s proceeds iteratively with NIPALS algorithm • NIPALS: non-linear iterative least squares (Herman Wold) t1 t2 x3 x1 y x2
Partial Least Squares (PLS) • Similar to PCA • PLS: Partial Least Squares/Projection to Latent Structures/Please Listen to Svante • T’s are now called scores or latent variables and the p’s are the loading vectors • Loading vectors are not orthogonal anymore and influenced by y vector • A special version of NIPALS is also used to build up t’s t2 t1 x3 x1 y x2
Kernel PLS (K-PLS) • Invented by Rospital and Trejo (J. Machine Learning, December 2000) • Consider K-PLS as a better and nonlinear PLS • K-PLS gives almost identical results to SVMs for the QSAR data we tried • K-PLS is a lot faster than SVMs t2 t1 x3 x1 y x2
R T S P Q