Download
1 / 41
410 likes | 545 Views
22. The CPI and the Cost of Living. CHAPTER. C H A P T E R C H E C K L I S T. When you have completed your study of this chapter, you will be able to. 1 Explain what the Consumer Price Index (CPI) is and how it is calculated.

E N D
22 The CPI and the Cost of Living CHAPTER
C H A P T E R C H E C K L I S T When you have completed your study of this chapter, you will be able to • 1Explain what the Consumer Price Index (CPI) is and how it is calculated. • 2 Explain the limitations of the CPI and describe other measures of the price level. 3 Adjust money values for inflation and calculate real wage rates and real interest rates.
22.1 THE CONSUMER PRICE INDEX • Consumer Price Index (CPI) is a measure of the average of the prices paid by urban consumers for a fixed market basket of consumer goods and services. • The BLS calculates the CPI every month. • We can use these numbers to compare what a fixed basket of goods costs this month with what it cost in some previous month.
22.1 THE CONSUMER PRICE INDEX • Reading the CPI Numbers • The CPI is defined to equal 100 for a period called the reference base period. • Reference base period is a period for which the CPI is defined to equal 100. Currently, the reference base period is 19821984.
22.1 THE CONSUMER PRICE INDEX • In August 2007, the CPI was 207.9. • The average of the prices paid by urban consumers for a fixed market basket of consumer goods and services was 107.9 percent higher in August 2007 than it was on the average during 19821984. • In July 2007, the CPI was 208.3. • The average of the prices paid by urban consumers for a fixed market basket of consumer goods and services decreased by 0.4 of a percentage point in August 2007.
22.1 THE CONSUMER PRICE INDEX • Constructing the CPI • Three stages: • Selecting the CPI basket • Conducting the monthly price survey • Calculating the CPI
22.1 THE CONSUMER PRICE INDEX • The CPI Basket • Make the relative importance of the items in the CPI basket the same as in the budget of an average urban household. • The CPI is calculated each month, but the CPI basket is not updated each month. • The current CPI basket in 2007 is based on information obtained from the Consumer Expenditure Survey conducted during 2005.
22.1 THE CONSUMER PRICE INDEX Figure 22.1 shows the CPI basket. This shopping cart is filled with the items that an average household buys.
22.1 THE CONSUMER PRICE INDEX • The Monthly Price Survey • Each month, BLS employees check the prices of the 80,000 goods and services in the CPI basket in 30 metropolitan areas. • Because the CPI measures price changes, it is important that the prices recorded refer to exactly the same items.
22.1 THE CONSUMER PRICE INDEX • Calculating the CPI • The CPI calculation has three steps: • Find the cost of the CPI basket at base period prices. • Find the cost of the CPI basket at current period prices. • Calculate the CPI for the base period and the current period. Table 22.1 on the next slide shows a simplified CPI calculation in which we assume a base period of 2005.
Cost of CPI basket at current period prices x 100 Cost of CPI basket at base period prices $50 $70 x 100 x 100 = 100 = 140 For 2005, the CPI is: $50 $50 For 2008, the CPI is: 22.1 THE CONSUMER PRICE INDEX CPI =
CPI in current year CPI in previous year x 100 Inflation rate = CPI in previous year 140 120 x 100 = 16.7 percent Inflation rate = 120 22.1 THE CONSUMER PRICE INDEX • Measuring Inflation • Inflation rate is the percentage change in the price level from one year to the next.
22.1 THE CONSUMER PRICE INDEX Figure 22.2 shows the CPI in part (a) and the inflation rate in part (b).
22.1 THE CONSUMER PRICE INDEX In part (a), the price level has increased every year. The rate of increase was rapid during the early 1980s and slower during the 1990s.
22.1 THE CONSUMER PRICE INDEX In part (b), the inflation rate was high during the early 1980s, but low during the 1990s.
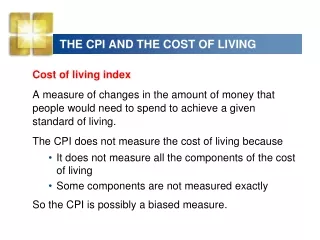
22.2 THE CPI AND OTHER PRICE LEVEL MEASURES • Cost of living index is a measure of changes in the amount of money that people would need to spend to achieve a given standard of living. • The CPI does not measure the cost of living because • It does not measure all the components of the cost of living • Some components are not measured exactly • So the CPI is possibly a biased measure.
22.2 THE CPI AND OTHER PRICE LEVEL MEASURES • Sources of Bias in the CPI • The potential sources of bias in the CPI are • New goods bias • Quality change bias • Commodity substitution bias • Outlet substitution bias
22.2 THE CPI AND OTHER PRICE LEVEL MEASURES • New Goods Bias • New goods do a better job than the old goods that they replace, but cost more. • The arrival of new goods puts an upward bias into the CPI and its measure of the inflation rate. • Quality Change Bias • Better cars and televisions cost more than the versions they replace. • A price rise that is a payment for improved quality is not inflation but might get measured as inflation.
22.2 THE CPI AND OTHER PRICE LEVEL MEASURES • Commodity Substitution Bias • If the price of beef rises faster than the price of chicken, people buy more chicken and less beef. • The CPI basket doesn’t change to allow for the effects of substitution between goods. • Outlet Substitution Bias • If prices rise more rapidly, people use discount stores more frequently. • The CPI basket doesn’t change to allow for the effects of outlet substitution.
22.2 THE CPI AND OTHER PRICE LEVEL MEASURES • The Magnitude of the Bias • The Boskin Commission estimated the bias to be 1.1 percentage points per year. • If the measured inflation rate is 3.1 percent a year, most likely the actual inflation rate is 2.0 percent a year. • To reduce the bias, the BLS has decided to increase the frequency of its Consumer Expenditure Survey and revise the CPI basket every two years. • When the BLS revises the CPI basket, the reference base period does not change.
22.2 THE CPI AND OTHER PRICE LEVEL MEASURES • Two Consequences of the CPI Bias • Two main consequences of the bias in the CPI are • Distortion of private contracts • Increases in government outlays and decreases in taxes • Distortion of Private Contracts • Many wage contracts are linked to the CPI. • If the CPI is biased, these contracts might deliver an outcome different from that intended by the parties.
22.2 THE CPI AND OTHER PRICE LEVEL MEASURES Suppose that the UAW and GM sign a 3 year wage deal: In the first year, the wage will be $30 an hour and will rise by the inflation rate in the next two years. If the inflation rate is 5 percent a year, the wage rises to $31.50 an hour in the second year and $33.08 an hour in the third year. But if the actual inflation rate is 2 percent a year, the intended wages in the second and third years are $30.90 an hour and $31.83 an hour. The workers’ gain is GM’s loss. With thousands of workers, GM’s loss would be millions of dollars over the 3 years.
22.2 THE CPI AND OTHER PRICE LEVEL MEASURES • Increases in Government Outlays and Decreases in Taxes • Close to a third of federal government outlays are linked directly to the CPI. • The CPI is used to adjust • 48 million Social Security benefit payments • 22 million food stamp payments • 4 million pensions for retired military personnel, federal civil servants, and their surviving spouses • the budget for 27 million school lunches
22.2 THE CPI AND OTHER PRICE LEVEL MEASURES • The CPI is used to adjust the income levels at which higher tax rates apply. • Because tax rates on large incomes are higher than those on small incomes as incomes rise, the burden of taxes would rise relentlessly if these adjustments were not made. • To the extent that the CPI is biased upward, the tax adjustments over-compensate for rising prices and decrease the amount paid in taxes.
22.2 THE CPI AND OTHER PRICE LEVEL MEASURES • Alternative Measures of the Price Level • Several alternative measures of the price level are available. • Here we look at • The GDP deflator • The personal consumption expenditures deflator (PCE deflator)
22.2 THE CPI AND OTHER PRICE LEVEL MEASURES • GDP Deflator • The GDP deflator is an average of current prices of all the goods and services included in GDP expressed as a percentage of base-year prices. • GDP deflator = (Nominal GDP Real GDP) 100. • The GDP deflator is a measure of the price level and the percentage change in the GDP deflator is a measure of the inflation rate.
22.2 THE CPI AND OTHER PRICE LEVEL MEASURES Two key differences between the GDP deflator and the CPI result in different estimates of the price level and inflation rate. • The GDP deflator uses the prices of all the goods and services in GDP whereas the CPI uses prices of consumption goods and services only. • 2. The GDP deflator weights each item using information about current as well as past quantities. In contrast, the CPI weights each item using information from a past consumer expenditure survey.
22.2 THE CPI AND OTHER PRICE LEVEL MEASURES • Because the GDP deflator uses information on current year quantities, it includes new goods and quality improvements and even allows for substitution effects of both commodities and retail outlets. • So in principle, the GDP deflator is not subject to the biases of the CPI.
22.2 THE CPI AND OTHER PRICE LEVEL MEASURES • In practice, the GDP deflator suffers from some of the CPI’s problems because the Commerce Department does not directly measure the physical quantities of all the goods and services that are produced. • Instead, to estimate quantities, the Commerce Department divides expenditures by price indexes. • And one of these price indexes is the CPI. • So the biased CPI injects a bias into the GDP deflator.
22.2 THE CPI AND OTHER PRICE LEVEL MEASURES • PCE Deflator • ThePCE deflatoris an average of current prices of all the goods and services included in the consumption expenditure component of GDP expressed as a percentage of base-year prices. • The PCE deflator has the same advantages as GDP deflator—it uses current information on quantities and to some degree overcomes the sources of bias in the CPI. • The PCE deflator, like the CPI, is a possible measure of the cost of living.
22.2 THE CPI AND OTHER… Figure 22.3 shows the three measures of inflation in part (a) and the corresponding measures of the price level in part (b). The three measures of the inflation rate fluctuate together, but the CPI measure rises more rapidly than the GDP deflator measure or the PCE deflator measure.
22.2 THE CPI AND OTHER … In part (b), the CPI measure of the price level is the highest and the PCE deflator lies between the CPI and the GDP deflator. The CPI measure overstates the inflation rate.
CPI in 2007 Price of stamp in 1907 dollars x CPI in 1907 207.2 = 41 cents = 2 cents x 10 22.3 NOMINAL AND REAL VALUES • Dollars and Cents at Different Dates • To compare dollar amounts at different dates, we need to know the CPI at those dates. • Convert the price of a 2-cent stamp in 1907 into its 2007 equivalent: Price of stamp in 2007 dollars =
22.3 NOMINAL AND REAL VALUES • Nominal and Real Values in Macroeconomics • Macroeconomics makes a big issue of the distinction between nominal values and real values: • Nominal GDP and real GDP • Nominal wage rate and real wage rate • Nominal interest rate and real interest rate • We studied the distinction between and calculation of nominal and real GDP in Chapter 21. Here, we’ll look at the other two.
22.3 NOMINAL AND REAL VALUES • Nominal and Real Wage Rates • Nominal wage rate Iis the average hourly wage rate measured in current dollars. • Real wage rate is the average hourly wage rate measured in the dollars of a given reference base year.
Nominal wage rate in 2006 x 100 Real wage rate in 2006 = CPI in 2006 $16.73 x 100 = $8.23 Real wage rate in 2006 = 201.6 22.3 NOMINAL AND REAL VALUES To calculate the real wage rate, we divide the nominal wage rate by the CPI and multiply by 100. That is, The $8.23 amount is in 19821984 dollars.
22.3 NOMINAL AND REAL VALUES Figure 22.4 shows nominal and real wage rates: 1982–2006. The nominal wage rate has increased every year since 1982. The real wage rate decreased slightly from 1982 through the mid-1990s, after which increased slightly.
22.3 NOMINAL AND REAL VALUES • Nominal and Real Interest Rates • Nominal interest rate is the percentage return on a loan expressed in dollars. • Real interest rate is the percentage return on a loan, calculated by purchasing power—the nominal interest rate adjusted for the effects of inflation. • Real interest rate = Nominal interest rate – Inflation rate.
22.3 NOMINAL AND REAL VALUES Figure 22.5 shows real and nominal interest rates: 1967–2007. During the 1970s, the real interest rate became negative. The nominal interest rate increased during the high-inflation 1980s.