Download
1 / 25
260 likes | 348 Views
Prediction of Atomic Web Services Reliability Based on K-means Clustering. ESEC/FSE, Saint Petersburg, Russia, 2013. Consumer Computing Laboratory Faculty of Electrical Engineering and Computing University of Zagreb, Croatia. http://ccl.fer.hr/ http://www.fer.hr/ http://www.unizg.hr/.

E N D
Prediction of Atomic Web Services Reliability Based on K-means Clustering ESEC/FSE, Saint Petersburg, Russia, 2013. Consumer Computing Laboratory Faculty of Electrical Engineering and Computing University of Zagreb, Croatia http://ccl.fer.hr/ http://www.fer.hr/ http://www.unizg.hr/ Marin Silic, GoranDelac and SinisaSrbljic
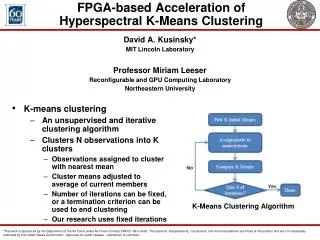
Outline • Motivation • Reliability in SOA • State-of-the-art • CLUS Approach • Evaluation • Conclusion
Motivation • Contemporary web applications - SOA A 4 A 2 A 1 A 5 A 3 Web Application
Process of candidates selection A 2 A 4 A 1 A 2 A 1 A 3 A 4 A 3 A 5 A 6 Composite service Repository Functional properties Nonfunctional properties Reliability Availability Ensure the desired functionality … Impact Qos & QoE
“Reliability on demand” definition REQ A 2 A 4 RES A 6 A 1 Application A 5 A 3 Service Oriented System The ratio of successful against total number of invocations Past Invocation Sample
Drawbacks/Obstacles • Client’s vs. provider’s perspective • Service invocation context • Depends on the quality of the sample • Acquiring a sample proves to be a difficult task A 3 A 2 QoS2 A 1 A 1 Client QoS QoS QoS A 5 A 4 A 6 QoS QoS QoS QoS1 Client Service Provider ≠ ≠ QoS2 QoS QoS1
Insight to the Solution • To overcome the drawbacks and obstacles • Collect partial, but relevantpast invocation sample • Utilize prediction methodsto estimate the reliability for the missing records
State-of-the-art • Collaborative filtering uimatrix nservices m,n>> ? p11 ? … p1i … ? p1n matrix is extremely sparse ? ? p22 … ? … ? ? … … … … … … … … m users ? pu1 ? … pui … ? pun number of values to predict … … … … … … … … ? pm1 ? … pmi … ? pmn
Collaborative filtering • Computes the similarity using PCC • Matrix can be employed in two different ways IPCC approach p11 ? … p1i … ? p1n UPCC approach Hybrid approach ? p22 … ? … ? ? … … … … … … … pu1 ? … pui … ? pun … … … … … … … pm1 ? … pmi … ? pmn
Disadvantages of Collaborative Filtering • Scalability • Having millions of users and services – these approaches do not scale • Accuracy in dynamic environments • Internet is a highly dynamic system • Do not consider environment conditions
CLUStering • To address scalability • Applies the principle of aggregation • Reduces the redundant data by clustering users and services using K-means • To improve the accuracy • Introduces environment-specific parameters • Disperses the collected data across the additional dimension
CLUS Overview Data Clustering Phase Users Clustering (1c) (3c) (5c) Environment Clustering Creation of D Clustered Data Raw Data Services Clustering (4c) (2c) Prediction Phase Prediction p(r) r(u, s, t)
Environment-specific Clustering • Set of environment conditions e1 e2 … ei … en K-means clustering w1 w2 wi wc A day … … t1 t0 ti-1 ti tc-1 tc
User-specific Clustering • Set of users clusters u1 u2 … ui … um K-means clustering e1 e2 … ei … en … …
Service-specific Clustering • Set of services clusters s1 s2 … si … sl K-means clustering e1 e2 … ei … en … …
Creation of Space D • Each record, r(u, s, t), is associated to the belonging clusters uk, sj, ei • Each entry in D is computed as follows: • R contains all the records that belong to clusters uk, sj, ei
Prediction • Assuming an ongoing rc=(uc, sc, tc) • First, it checks the collected sample: • If H is not empty • Otherwise,
Evaluation • Comparison with the state-of-the-art • UPCC • IPCC • Hybrid • Evaluation measures • Prediction accuracy • MAE, RMSE • Prediction performance • Aggregated prediction time
Evaluation • Experiment setup • Amazon EC2 Cloud Data
Evaluation • Results – Impact of data density • Prediction accuracy – with load intensity
Evaluation • Results – Impact of data density • Prediction performance– with load intensity
Evaluation • Results – Impact of number of clusters • Prediction accuracy, Data density = 20%
Evaluation • Results – Impact of number of clusters • Prediction performance, Data density = 20%
Conclusion • Proposed a CLUS approach • Improved the prediction accuracy • By introducing environment-specific parameters • At least 56% lower RMSE value than the state-of-the-art • Improved the prediction performance • By applying principle of aggregation • Execution time reduced for two orders of magnitude when compared to the state-of-the-art • Flexibility of approach • Trade-off between accuracy and scalability • Can be applied in different environments
Q&A • Thanks the audiencefor listening.