Download
1 / 25
250 likes | 359 Views
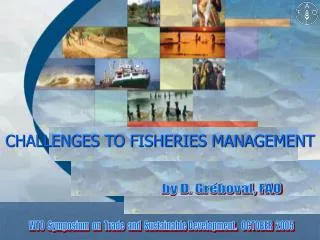
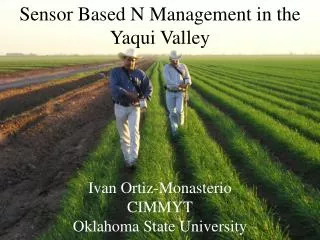
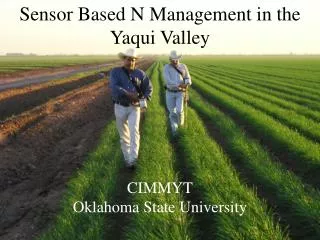
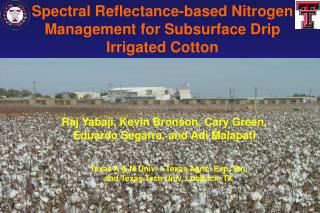
E.M. Barnes 1 , T. Sharp 2 , J. Wilkerson 3 , Randy Taylor 2 , Stacy Worley 3. Challenges to sensor-based N-Management for Cotton. 1 Cotton Incorporated, Cary NC 2 Oklahoma State University, Okmulgee & Stillwater 3 University of Tennessee, Knoxville. Acknowledgements.

E N D
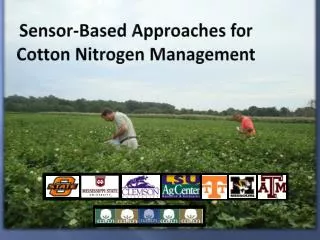
E.M. Barnes1, T. Sharp2, J. Wilkerson3, Randy Taylor2, Stacy Worley3 Challenges to sensor-based N-Management for Cotton 1Cotton Incorporated, Cary NC 2Oklahoma State University, Okmulgee & Stillwater 3University of Tennessee, Knoxville
Acknowledgements • Tom Clarke, Glenn Fitzgerald, P. Pinter • USDA, ARS, Arid Land Research Center • Maricopa, AZ • Pete Waller, University of Arizona • Paul Colaizzi, USDA, ARS – Lubbock, TX • Julio Haberland – Chile • Mike Kostrzewski - Arizona
Outline • Cotton 101 • Why cotton interest in sensors is high • The challenges of Cotton • One proposed solution
The Cotton Belt Data from USDA, NASS
Cotton & Nitrogen • Perennial plant managed as an annual • Indeterminate flowering pattern • ~50 lbs-N per lint bale (1 bale = 480 lbs) • Over-application of N: • Energy partition to vegetative vs. reproductive development • Large plants prevent efficient harvest • Growth regulators applied to control vegetative development
Why interest in sensors now? • Cost of N • Producers receiving In-Time images • And now Deere imagery through Jimmy Sanders • On-farm tests done in Alabama to use GreenSeekerTM to apply growth regulator (PIX) • Cotton researchers joining in
4.5 gpa, 24 fl. oz Prep, 1.5 dry oz Dropp 1 Lowest Biomass 5.0 gpa 2 6.0 gpa 3 7.0 gpa 4 8.0 gpa 5 8.0 gpa 6 8.0 gpa, 42.67 fl. oz Prep , 2.67 dry oz Dropp 7 Highest Biomass Variable Rate Defoliation Location: Arkansas Delta Crop: Cotton Field Size: 339.5 Acres Imagery Acquired: September 7, 2004 VR Defoliation Applied: September 14, 2004 Notes: This prescription was applied using a hydraulic aerial VR system. The consultant was able to achieve a one-time defoliation on this field, for $15.94/A in chemical.
1 Lowest Biomass 2 3 4 5 6 7 Highest Biomass 0 lbs./A 0 lbs./A 100 lbs./A 100 lbs./A 100 lbs./A 0 lbs./A 0 lbs./A Variable Rate Nitrogen Top-Dressing Location: Arkansas Delta Crop: Cotton Field Size: 156.53 A’s Imagery Acquired: July 5, 2004 VR Fertilizer Applied: July 13, 2004 Notes: This prescription was applied using a variable rate equipped high clearance spreader. Unity [16% nitrogen (N)] was applied midseason, to supplement areas in the field which had become N deficient. Classes 1 and 2 were beyond salvaging with the additional N, while classes 6 and 7 required no additional N.
Wind blows & Index Changes + Heliotropic; + New Growth
Sample data set • 1999 Growing season • AGIIS sensor (calibration panel every minute) • Water and Nitrogen treatments
1999 CCCI (relative to WN) Last N Application Green Boll Open Boll Squares
Combining Data • Use NDVI / Greenseeker as a “biomass” sensor • Historic yield maps.
Conclusions • Cotton can be tricky to manage • Efforts to apply sensors for N management are increasing rapidly • Hope to learn from work here most efficient methods to develop cotton N management strategies
AgIIS (Agricultural Irrigation Imaging System) Bands (nm):Green (555), Red (670), Edge (720), NIR (790)IRT
October 1, 1999 AgIIS Field during 1999 Cotton Season
CCCI A C CCCI = (C-B)/(A-B) B
1999 RVI (relative to WN) Last N Application Green Boll Open Boll Squares