Download
1 / 17
170 likes | 305 Views
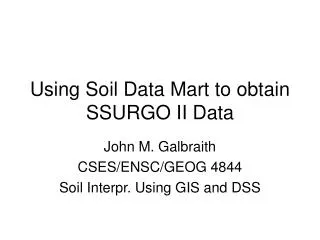
Soil survey information at various scales: (1) on-site, (2) WebGIS, SSURGO, (3) STATSGO, (4) MLRA, Ecoregions Map, (5) FAO, WRB, and NRCS World Soil Resources. CSES/ENSC/GEOG 4244 Soil Interpretation Using GIS and DSS 2/8/06. On-site soil survey (Order 1, scales 1:100 to 1:4,800).

E N D
Soil survey information at various scales: (1) on-site, (2) WebGIS, SSURGO, (3) STATSGO, (4) MLRA, Ecoregions Map, (5) FAO, WRB, and NRCS World Soil Resources CSES/ENSC/GEOG 4244 Soil Interpretation Using GIS and DSS 2/8/06
On-site soil survey (Order 1, scales 1:100 to 1:4,800) • Read an example of instructions for on-site work on the Blackboard site • On-site for septic systems • On-site for wetland delineation • On-site soil interpretive map
. . . . Soil Survey and Hydrology 2 ft contours Map unit symbols PoB Map area boundary Drainage Example on-site map Scale 3/8 inch = 100 feet 3/8 inch = 0.375 in 100 feet = 1200 in 0.375 = 1200 reduces to 1: 3200 CTD V PoB V CTB PoC CTD V PoA CTC PoB V PoC Map unit legend and spot symbols next page CTE CTD PT See that some hydrology is one dot and some is three dots?
Web GIS (ArcIMS products) • These are interactive GIS sites. • The local creator and distributor is Anderson & Assoc., Blacksburg, VA • http://www.webgis.net/ • Select “WebGIS sites” tab at top • This is order 2 mapping (SSURGO 2.x)
Web Soil Survey • Order 2, Scales 1:12,00 to 1:24,000 • Advantages: quick, easy, background imagery and labels included, no experience with GIS or soil survey necessary • Disadvantages: relies on Internet connection and the internet site being operational, can only select areas of 10,000 acres or less, not all survey areas are available yet
SSURGO 2.x • Order 2, Scales 1:12,00 to 1:24,000 • Advantages: get complete spatial and tabular data set for entire survey area, not limited in size or “screen view,” but not quick or easy to casual user • Disadvantages: relies on Internet connection and the internet site being operational, must have working knowledge of GIS (IF Soil Data Viewer not available, must also have working knowledge of soil survey tables and data), not all areas available yet, no imagery included
STATSGO • Order 3, 1:250,000 scale. Original version 1987, set for update on 2/28/2006. • The State Soil Geographic Data Base (STATSGO), explained in Miscellaneous Publication Number 1492, was designed primarily for regional, multi-state, river basin, state, and multi-county resource planning, management, and monitoring. STATSGO data are not detailed enough to make interpretations at a county level (but SSURGO is). STATSGO was last updated in 1996 but is scheduled for revision and update. • Soil maps for STATSGO are compiled by generalizing more detailed (SSURGO 2.x) soil survey maps. Where more detailed soil survey maps are not available, data on geology, topography, vegetation, and climate are assembled with Land Remote Sensing Satellite (LANDSAT) images. Soils of like areas are studied, and the probable classification and extent of the soils are determined. • Map unit composition for a STATSGO map is determined by transecting or sampling areas on the more detailed maps and expanding the data statistically to characterize the whole map unit. • Disadvantages: No Soil Data Viewer or Access Database Template to help link tables or build reports and make interpretaive maps. • Advantages: Covers huge area, easy to use maps, 100% composition of map units, easy to link to single-occurrence tables through MUID column. • Available at: http://www.ncgc.nrcs.usda.gov/products/datasets/statsgo/
STATSGO Map Unit Composition Table Example: Map Unit VA001 from VA STATSGO
Major Land Resource Area (MLRA) (~Ecoregion) • Order 4, 1:750,000 scale • Data and map units produced in 1981! Due for Update 2006. Will be called NATSGO when updated. • Available on-line at: http://soils.usda.gov/survey/geography/mlra/index.html • Interactive MLRA Map (1997) and Narrative (1981) • GIS files available at: http://www.nrcs.usda.gov/technical/land/aboutmaps/coverages.html • The link to GIS coverage files is in the metadata file called “Major Land Resource Area coverages” : Continental United States Alaska Hawaii Puerto Rico Guam and the Northern Marianas These .e00 zipped coverages include Land Resource Regions
FAO Soils Map of the World (World Reference Base) • Order 5, 1:5,000,000 scale. • 5 x 5 arc-minute pixels • Available from: DIGITAL SOIL MAP OF THE WORLD AND DERIVED SOIL PROPERTIES ON CD-ROM at:http://www.fao.org/ag/agl/agll/dsmw.htm • Download on-line from http://www.lib.berkeley.edu/EART/fao.html • The 1988 World Reference Base is the database that accompanies the map. WRB is being updated 1/2006. Available at: http://www.fao.org/documents/show_cdr.asp?url_file=/docrep/W8594E/W8594E00.htm
NRCS World Soil Resources • USDA-NRCS Global Soils Maps • Using US Soil Taxonomy as database • Available at: http://soils.usda.gov/use/worldsoils/index.html • Global and Regional Maps: http://soils.usda.gov/use/worldsoils/mapindex/ • Browse the site for more information