Download
1 / 43
430 likes | 593 Views
Potassium Nutrition in the Northern Great Plains. Outline: Potassium (K) Nutrition in the Northern Great Plains. Role of K in crop production Soil K and soil test levels Crop uptake of K K deficiencies Crop responses to K Chloride (Cl) response Fertilizer K.

E N D
Outline: Potassium (K) Nutrition in the Northern Great Plains • Role of K in crop production • Soil K and soil test levels • Crop uptake of K • K deficiencies • Crop responses to K • Chloride (Cl) response • Fertilizer K Photo courtesy of Lyle Cowell, SWP
What Is the Role of Kin Plants? • K activates enzyme reactions • K controls water uptake and transpiration • K influences energy production in photosynthesis and respiration • K supports photosynthate transport • K fosters nitrate-nitrogen (N) uptake and protein synthesis • K is required for starch synthesis in seeds
Unavailable (90 to 98%) K+ K+ K K+ Soil Water K Soil Minerals (feldspar, mica) K+ K K K Readily available (0.1 to 2%) K+ K+ K+ K+ Soil Colloid SoilColloid Trapped K K+ K+ K+ K+ Soil Colloid Slowly available (1 to 10%) Soil K
Soil Testing Methodsfor K • Most soil tests for K are based on either an ammonium acetate extraction or a similar extraction • In some regions with low CEC soils, K rates are often based on the ratio of K relative to other bases, such as Ca and Mg • Ion exchange membranes which measure the soil supply rate of K
AB SK MB 201 254 207 MT ND 259 265 2005 North American-wide 154 ppm Median Ammonium Acetate Equivalent Soil Test K Levels, 2005
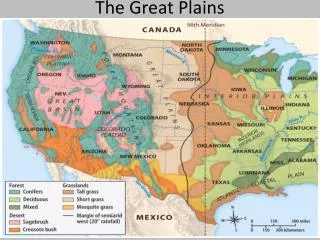
May be deficient in K May need K for irrigated crops K Deficient Areas on Canadian Prairies
Potassium Soil Test Ratingand Recommendations • Soil test recommendations vary among labs. • Most labs use a set of regional crop response data to develop fertilizer recommendations based on a K soil test. An example: Wheat K2O recommendations using band application (Agvise Labs)
What Are the K Requirements of Crops throughout the Season? Photo courtesy of Lyle Cowell
K Uptake of Wheat Duringthe Growing Season Jacobsen et al., 1992 (graphic from Korb et al., 2002)
Crop Uptake of K K uptake in Crop Yield/A total crop, lb K2O/A Wheat 40 bu 80 (19)* Canola 35 bu 89 (20) Peas 50 bu 150 (39) Barley silage 4.5 tons 132 Alfalfa 3 tons 180 *K removed in grain in parenthesis.
58 60 49 50 38 40 Barley grain yield, bu/A 30 11 20 10 0 60 120 0 240 K2O rate in lb/A Potassium DeficiencySymptoms in Barley
State or Province Crop Removal Fertilizer Applied Recoverable Manure Balance (R) (F) (M) F-R F+M-R --------------------- K2O, million lb --------------------- Alberta 607 128 136 -479 -343 Saskatchewan 640 59 43 -581 -538 Manitoba 332 92 45 -240 -195 Montana 352 42 9 -310 -301 North Dakota 609 52 13 -557 -544 Potassium Budget in the Northern Great Plains Region, 2000-2001
% K in plant tissue Crop type -- stage Deficient Low Sufficient High Wheat – tillering <1.2 1.3 – 1.5 1.6 – 3.0 3.1 – 9.9 Wheat – boot <1.4 1.5 – 1.9 2.0 – 2.4 2.5 – 3.5 Wheat – heading <1.2 1.3 – 1.5 1.6 – 3.0 3.1 – 9.9 Alfalfa – top 6 in. <1.7 1.8 – 2.4 2.5 – 3.8 3.9 – 4.7 Agvise Labs Plant Tissue K Guidelines for Crops … An Example
Crop Responses to K • While many northern Great Plains soils have abundant K, the region also has areas with very low soil K • It is not uncommon to find areas of Saskatchewan and Alberta with soils testing 30 to 50 ppm K/A • Crops respond to K application in these low K soils
80 Soil K 25-50 ppm/A 70 60 50 % Grain Yield Increase 40 Soil K 50-75 ppm/A 30 Soil K 75-100 ppm/A 20 10 0 0 12 24 Added K, lbs K2O/A added to seed row N and P added to soil test recommendation D. Walker, Lacombe, AB Barley Response to Soil K Levels and Fertilizer K2O
70 60 Barley 50 72 ppm K/A 40 33 ppm K/A Grain yield, bu/A Canola 50 ppm K/A 30 Wheat 36 ppm K/A 20 30 ppm K/A 10 0 0 100 200 400 Added K (lb K O/A Broadcast + Incorp) 2 N and P added to soil test recommendation Henry and Halstead, 1968 Barley, Wheat, and Canola Response to K
K Benefits Crop Growth and Yield Longevity of Alfalfa Stands • K increases carbohydrate in the crown roots of alfalfa during fall growth to increase - Winter hardiness - Early spring re-growth
No K 100 lb K2O/yr Manitoba - Soil K 116 ppm/A (0 to 6 in.) 100 80 60 Stand density, % 40 20 0 Year 1 Year 2 Year 3 Year 4 Year 5 Year 6 Year 7 Plant counts in May as % of those the previous September K Helps Reduce Winterkill in Alfalfa
Crop Response onHigh K Soils • Yield increases often occur from potash applied on soils not deficient in K. Why? • K responses as a result of: - Cold soils in the spring (slow root growth and nutrient uptake) - Dry soils (droughty conditions reduce K diffusion) - Field (landscape) variability - Cl ion (Cl-) response
7 bu 60 50 6 bu 3 bu 40 Check Barley Yield (bu/A) 30 20 K2O 20 10 0 April 6 May 6 June 3 Barley Response to Starter K and Seeding Date Soil K levels - High Dubbs, Montana State Univ.
Frequency of response, % 5.5 bu/A 97 Expts. Winter Wheat 4.8 bu/A Spring Wheat 33 Expts 3.9 bu/A 48 Expts. Feed Barley 9.2 bu/A Malt Barley (irr.) 10 Expts. 36 Expts. 0.35 t/A Alfalfa 2.8 t/A Corn Silage 22Expts. 25 cwt/A Potatoes (irr.) 18 Expts. 0 20 40 60 80 Each crop represents 2 to 8 cropping years Soils testing > 600 ppm (1967-1979) Crop Response to Added K in High K Soils in Montana (264 Sites) Skogley & Haby 1981
Barley, oats, and rape – 1968-74 Crop Response to Added K in Alberta (548 sites) Exch. K Total Responsive Average ppm/A sites sites,% Resp., cwt/A 0 - 50 37 70 6.1 51 - 100 132 73 4.8 101 - 150 115 55 2.5 151 - 200 100 52 2.4 201 - 300 99 46 2.7 301 - 400 37 43 2.4 > 400 28 21 1.9 Lopetinsky 1977
35 30 Mean = 135 ppm Mode = 108 ppm 25 20 Frequency (%) 15 10 5 0 59-101 101- 143- 185- 227- 269- 143 185 227 269 311 Soil K (ppm) Frequency Distributionof Soil K on a 220 x 220 ft. Grid at Mundare, AB Penny et al., 1996
Chloride---An EssentialPlant Nutrient • The deficiency of Cl in the soil can account for crop responses to KCl application. • Earliest report of Cl crop response ... table salt (NaCl) in mid 1800s • Recognized as an essential micronutrient since the 1950s • Research in the late 1970s revealed insufficient levels in many areas
Crop Responses to Chloride • Chloride has been shown to have an effect on: • Root rot and foliar diseases in cereal crops • Seed weight at harvest, especially barley, by extending the grain filling period • Reducing physiological leaf spot in cereal crops on fields where soil Cl is less than 10 lb/A (24 in. depth) • Increasing crop yields
No Chloride Chloride Physiological Leaf Spot on Kestrel Winter Wheat
Chloride May ImproveCrop Yields • ~ 200 university trials in KS, MN, MT, ND, SD, MB, and SK have evaluated Cl response in wheat and barley • Included non-responsive and high Cl sites • Significant yield response in 48% of trials • Average yield response of 5 bu/A
12 1996 1997 1998 10 8 6 4 Yield response, bu/A 2 0 -2 -4 -6 Barrie Cora Grandin Karma Kyle Yield Boost from Chloride Depends on Wheat Variety
Once in the soil, all fertilizer sources are the same form as found in the soil (K+). This is the form taken up by plants. K+ K2SO4 KCl
Slowly Available K Available K Unavailable K What Happens to Fertilizer K in the Soil? • Absorbed by crop in year 1: • 20 to 60% of applied K • Highest recovery on low K soils • Slowly available K (future years): • Bulk of remaining K in most soil types • Future supply of K
Fertilizer K Sources Source Analysis Potassium chloride, KCl 0-0-60 (62) Potassium sulfate, K2SO4 0-0-50 - 17 Potassium nitrate, KNO3 13-0-44 Potassium-magnesium sulfate, K2SO4.2MgSO4 0-0-22-22-11 Potassium thiosulfate, K2S2O3 0-0-25-17
30 Seed row Side band 25 Broadcast 20 Grain Yield Increase (bu/A) 15 10 5 0 0 15 30 60 90 120 150 180 240 lb K O/A 2 N and P added to soil test recommendation SIP Soil Fertility Rpt, 1968 Barley Response to KCl Placement and Rate
Safe Rates of Seed Row K application (Saskatchewan) • Seed row application of K2O should not exceed(1 in. spread, 6 to 7 in. rows): • Cereals – 50 lb K2O/A • Canola – 20 lb K2O/A • Dry pea – 15 lb K2O/A • Combined P2O5 and K2O in the seed row should also not exceed the recommended safe rates for K2O alone Source: Saskatchewan Agriculture and Food
Corn 17 days old 100 80 60 Proportion of roots observed in K solution (%) 40 20 0 0 20 40 60 80 100 Proportion of roots expected for no K effect (%) Potassium Does Not Cause Roots to Proliferate • Split-root experiment • Percent of the total root system on the side with K was the same as that on the side without K • Effects of K on root growth may not be localized as is found with P Classen and Barber, 1977
Summary—K Nutrition in the NorthernGreat Plains • K nutrition is critical to crop production • Most northern Great Plains soils are high in K, allowing for a net removal of soil K each year • Crops take up as much K as N during growth, with only a small proportion removed in grain • Where deficient, crop response to K is greatest for barley, followed by wheat and canola • Crop responses to muriate of potash (KCl) can be a Cl response
International Plant Nutrition Institute655 Engineering Drive, Suite 110Norcross, GA 30092-2604Phone: 770-447-0335; Fax: 770-448-0439www.ipni.net Reference #06111