Download
1 / 12
120 likes | 263 Views
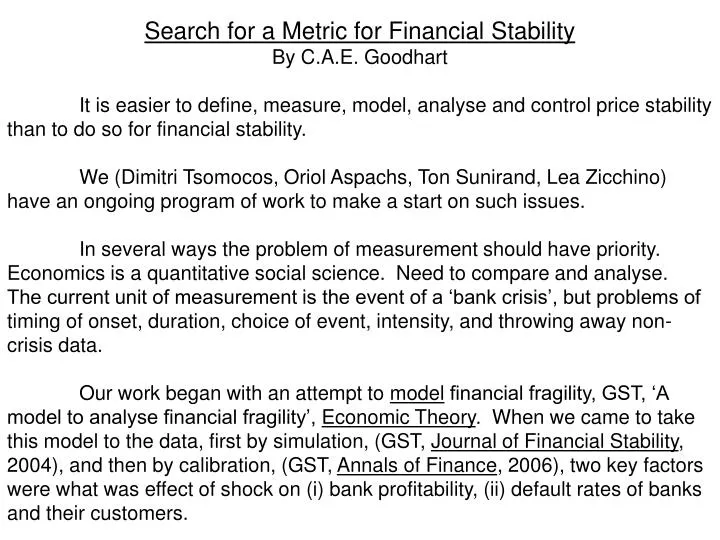
Search for a Metric for Financial Stability By C.A.E. Goodhart It is easier to define, measure, model, analyse and control price stability than to do so for financial stability.

E N D
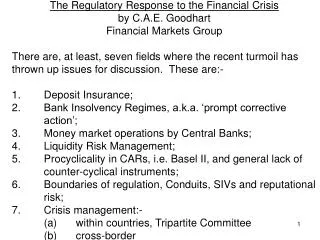
Search for a Metric for Financial Stability By C.A.E. Goodhart It is easier to define, measure, model, analyse and control price stability than to do so for financial stability. We (Dimitri Tsomocos, Oriol Aspachs, Ton Sunirand, Lea Zicchino) have an ongoing program of work to make a start on such issues. In several ways the problem of measurement should have priority. Economics is a quantitative social science. Need to compare and analyse. The current unit of measurement is the event of a ‘bank crisis’, but problems of timing of onset, duration, choice of event, intensity, and throwing away non-crisis data. Our work began with an attempt to model financial fragility, GST, ‘A model to analyse financial fragility’, Economic Theory. When we came to take this model to the data, first by simulation, (GST, Journal of Financial Stability, 2004), and then by calibration, (GST, Annals of Finance, 2006), two key factors were what was effect of shock on (i) bank profitability, (ii) default rates of banks and their customers.
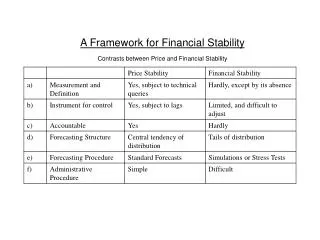
A Framework for Financial Stability Contrasts between Price and Financial Stability
A typical example from our latest paper (AGTZ 2006) shows the effects of a change in default penalties on interest rates, and bank profits, capital, capital ratio and repayment rates (default probabilities). In this example repayment rates go up, (i.e. default probabilities decline), whereas profits decline, primarily because banks choose a safer, less risky investment strategy. While normally the expectation is that profitability and default probabilities are inversely correlated, this is not always the case, especially when banks (are induced to) choose riskier (or less risky) strategies. Greater risk implies profits and PD should rise. Indeed, in our data base, the correlation between the % change in equity values, (our proxy measure of profitability) and estimated P.D. is only about -0.32 on a quarterly, and -0.61 on an annual, basis, being the average of the simple correlations in our seven countries.
So we felt forced to move to a two factor model, profitability and PD, regretfully so since we are seeking a single metric, and to achieve that from a 2 factor model requires some (estimated) factor weighting. Initially tried data from bank accounts, e.g. profits, NPLs, write-offs, etc., but did not work well:- (i) Accounting inconsistencies, both between countries and over time; (ii) Manipulation and smoothing; (iii) Long lags in reporting, especially write-offs. So we turned to market variables, equity values (as a proxy for profits) and PD, with the latter taken from the IMF. Note that estimate of PD incorporates both equity valuation and market volatility. So why is it not a sufficient statistic in itself?
Answers:- (i) Low correlation, already noted; (ii) What are the relevant weightings; e.g. Vol Ai = f (Vol Market, Vol Sector, Vol Company + covariances); (iii) Empirical Test. Our procedure was to examine relationships between GDP, our measure of social welfare, inflation, PD of banking sector and equity values of banking sector. Initial exercises, however, indicated that both PD and % changes in Eq were threshold variables. They only adversely affected GDP if worse than some level. Theshold levels chosen to maximise fit (n.b. small data set, few countries, short period). Anyhow individual and panel VAR, with four variable VAR and plus property prices, and plus interest rates as well.
Data set includes: Finland, Germany, Japan, Korea, Norway, Sweden and UK over period 1990, Q4 – 2004, Q4, (n.b. bank equity values only available for Norway and Finland from 1996 onwards, and for Sweden from 2000 onwards). Results: Surprisingly good for Panel; Supportive, but not totally so for individual countries. What does this suggest:- (a) for weighting of Eq and PD? (b) for effects on GDP of individual countries?
Can we get a single metric, comparable over time and across countries for financial stability? Yes, conditional on:- (i) methods (transformation, etc.) used to estimate PD (ii) estimation of relative weights of PD and Eq from empirical exercises What does it look like in our case? Note that PD much stronger influence on GDP than Eq, (as might have been expected), so what determines PD? Further, separate work by Goodhart, Hofmann and Segoviano, ‘Default, Credit Growth and Asset Prices’, IMF (2005/6).