Download
1 / 16
160 likes | 392 Views
EPE/EDP 557. Key Concepts / Terms Empirical vs. Normative Questions Empirical Questions Normative Questions Statistics Descriptive Statistics Inferential Statistics Populations & Samples Population Parameter Sample Statistic

E N D
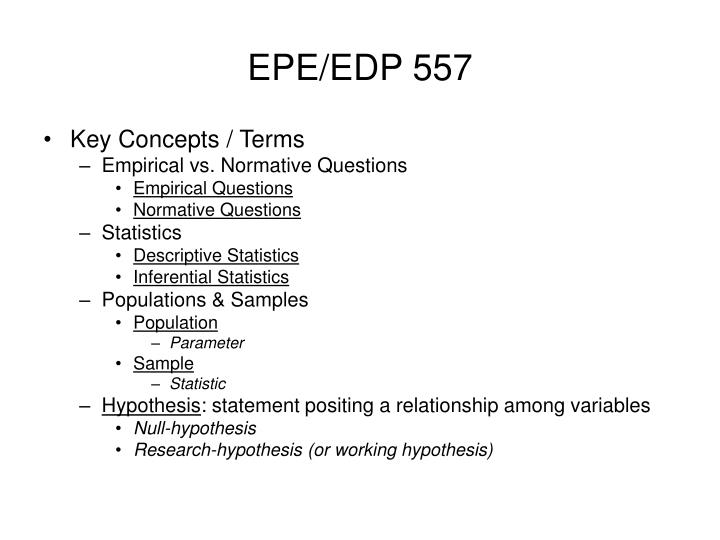
EPE/EDP 557 • Key Concepts / Terms • Empirical vs. Normative Questions • Empirical Questions • Normative Questions • Statistics • Descriptive Statistics • Inferential Statistics • Populations & Samples • Population • Parameter • Sample • Statistic • Hypothesis: statement positing a relationship among variables • Null-hypothesis • Research-hypothesis (or working hypothesis)
EPE/EDP 557 • Key Concepts / Terms • Variable: concept, characteristic, or state of being that can vary from one observation to another • Nominal: attributes • Ordinal: ranks or orders • Interval: consistent numeric scale with arbitrary zero • Ratio: consistent numeric scale with meaningful zero • Distribution: arrangement/listing of a set of scores in order of magnitude • Frequency Distribution: listing of achieved scores in order of magnitude & corresponding listing of the number of occurrences of each score
Distribution 100 90 90 80 70 70 70 60 50 50 Frequency Distribution X f 100 1 90 2 80 1 70 3 60 1 50 2 EPE/EDP 557
EPE/EDP 557 • Central Tendency • Mean (M): simple average • e.g. 3, 4, 4, 5, 9 • ΣX = 3 + 4 + 4 + 5 + 9 = 25 • N = 5 • 25 ÷ 5 = 5 • Median (Mdn.): middle score • If N is odd, use middle score • If N is even, take average of 2 middle scores • Mode (Mo.): most frequent score(s)
EPE/EDP 557 • Central Tendency • Skewed Distribution: distribution unbalanced by extreme scores in one direction
EPE/EDP 557 • Central Tendency • Skewed Distribution:
EPE/EDP 557 • Bar Graphs, Histograms, & Frequency Polygons • Bar Graph:
EPE/EDP 557 • Bar Graphs, Histograms, & Frequency Polygons • Histogram:
EPE/EDP 557 • Bar Graphs, Histograms, & Frequency Polygons • Frequency Polygon:
EPE/EDP 557 • Variability: • describe the degree to which scores are spread out / dispersed • provide information about how scores differ (vary) • 3 major measures of variability: • Range (R) • Variance (V) • Standard Deviation (SD)
EPE/EDP 557 • Measures of Variability: • Range: • Simplest measure of variability • Range = highest score – lowest score • Fractiles: • Used to locate specific points in a distribution • Not actual measures of variability, but…
EPE/EDP 557 • Measures of Variability: • Standard Deviation: • The “Heart & Soul” of the concept of variability • Provides information on the average deviation of scores from the mean in a distribution • Sample Standard Deviation: or
SD Deviation Method EPE/EDP 557
EPE/EDP 557 • SD Computational Method
EPE/EDP 557 • Variability (Dispersion) • Variance: Provides information on how far all of the scores in a distribution deviate from the mean
EPE/EDP 557 • Variability: • Kurtosis: the degree of curvature of a unimodal distribution of scores • Flat = Platykurtic (below left) • Peaked = Leptokurtic (below right)