Download
1 / 23
230 likes | 314 Views
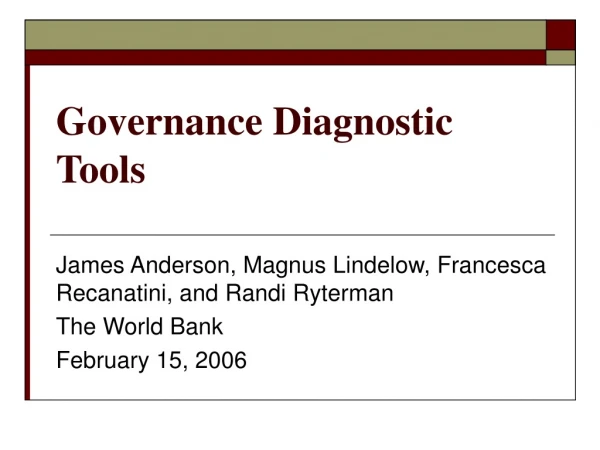
Diagnostic Tools for Judicial Reform. Moving Beyond the Sector Assessment January, 2004. Some Personal Biases. We are doing development projects, not just making loans Projects should aim at resolving societally significant problems with effective remedies

E N D
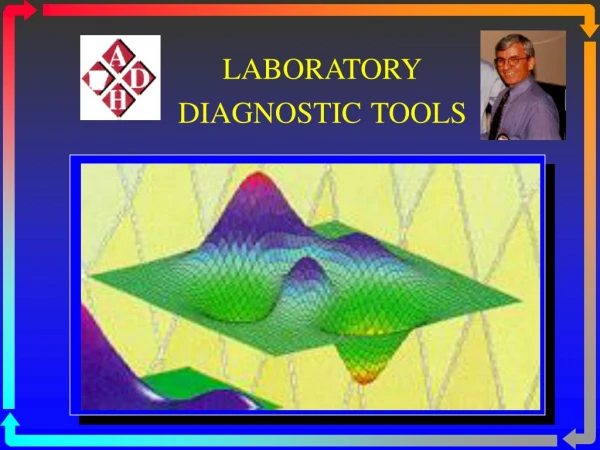
Diagnostic Tools for Judicial Reform Moving Beyond the Sector Assessment January, 2004
Some Personal Biases • We are doing development projects, not just making loans • Projects should aim at resolving societally significant problems with effective remedies • Judicial reform projects could do better here – impacts as opposed to just outputs • Information and analysis are key
Why we need better tools • Sector assessments give overview • Methodology emphasizes “what everyone knows” • Perspectives of the usual suspects • Remedies reflect fads and too often produce Christmas trees • No baseline for measuring progress
Alternatives • Not to replace SA, but to expand on and validate its contents • All have strengths and weaknesses • Applicability depends on resources and problems to be explored • While offer more “precision,” it is important to recognize their limitations
Public Opinion Surveys • Examples: WBI country surveys, cross-country governance indicators, Investment Climate Analyses, cross national polls like Latinobarometro • Strengths: demonstrate perceived problem, can put in comparative perspective, get leaders’ attention • Weaknesses: perceptions, insufficiently specific, may reflect past not present, don’t tell you what to do.
Related tools • “Sherwood” focus on costs of justice • Doing Business • Strengths: same as above, but look more “scientific” • Weaknesses: quality of data, question of what they are measuring, do respondents interpret the questions the same way?
Analysis of Aggregate Statistics • Where any are available, they can test some conventional wisdom (Are workloads excessive? Are budgets too small? Is litigation rate high?) • Also identify some unsuspected trends • Interpretation requires comparative data • Poor quality calls for caution – incomplete, inconsistent categories, bad data entry • Work best in more developed systems or most developed sectors of underdeveloped
Analysis of Raw Data • With more automation, increasingly possible to access data on individual cases • Allows to disaggregate categories, cross variables, give better picture of what is happening to workload. • Same cautions as above – poorly managed systems contain many errors, inconsistent or unintelligible classifications • Still, over time will replace next example – sampling of case files
Case File Analysis • Here, manual style– random sample of physical case files drawn and analyzed • Data extracted on characteristics of interest (e.g. times, parties, amounts, stages) • Strengths – best way of tracking what happens to real cases • Weaknesses: expensive, slow, works best in more organized courtrooms, requires courts’ permission
Case File Analysis: Examples • Can test common beliefs – all plaintiffs are bankers, there is much delay, judicial bias • Can uncover unsuspected trends – most cases are not resolved, delays are in enforcement, attachment is an obstacle. • Can use flow charts to demonstrate alternative trajectories of cases • With a large enough sample can do statistical analysis of sections – crossing variables to identify internal trends
In-depth Institutional Analysis • Methodology like sector assessment, but problem focus (informed by other studies) • Combines inputs from various sources, statistics, interviews, informed observation • Best done by experienced specialist, but also requires multi-disciplinary approach and appreciation for broader impacts. • Probably a second-stage tactic, after initial problem identification
A Note on Judicial Governance • Focus has been on reform projects, for donors and dialogue with counterparts. • However, analysis is important for judicial managers, as part of their standard repertoire. • Their involvement in process, discussion of product can help reorient ideas about management. • Good management requires good information – at least in LAC, this is the forgotten element.
TABLES ILLUSTRATING USE OF DIAGNOSTIC TOOLSAGGREGATE STATISTICS FIGURE I: Comparative Statistics on Judicial Workloads
TABLES ILLUSTRATING USE OF DIAGNOSTIC TOOLSAGGREGATE STATISTICS FIGURE II: Comparative Statistics from Brazil’s National and State Court Systems (excluding juizados especiais
TABLES ILLUSTRATING USE OF DIAGNOSTIC TOOLSAGGREGATE STATISTICS,DISAGGREGATED BY MATERIAL FIGURE III: Brazil, Annual First Instance Filings per Judge (1999-2003)
TABLES ILLUSTRATING USE OF DIAGNOSTIC TOOLSAGGREGATE STATISTICS,DISAGGREGATED BY MATERIAL FIGURE IV: Brazil, Annual First Instance Dispositions per Judge (1999-2003)
TABLES ILLUSTRATING USE OF DIAGNOSTIC TOOLSAGGREGATE STATISTICS,DISAGGREGATED BY MATERIAL FIGURE V: Brazil, First Instance Filings Over Time (Labor Courts 1941—2003; Federal Courts 1967—2003; State Courts 1990—2003)
TABLES ILLUSTRATING USE OF DIAGNOSTIC TOOLSCASE FILE DATA FIGURE VI: Brazil, Ratio of Second Instance Filings to First Instance Dispositions
TABLES ILLUSTRATING USE OF DIAGNOSTIC TOOLSCASE FILE DATA FIGURE VII: Mexico, Juicios ejecutivos MERCANTILES (JEM)
TABLES ILLUSTRATING USE OF DIAGNOSTIC TOOLSCASE FILE DATA FIGURE VIII: Mexico, JEM, Value of Claims
TABLES ILLUSTRATING USE OF DIAGNOSTIC TOOLSCASE FILE DATA FIGURE IX: Mexico, JEM, Duration from initiation to closure
TABLES ILLUSTRATING USE OF DIAGNOSTIC TOOLSCASE FILE DATA FIGURE X Mexico, Juicios Ejecutivos: Characteristics associated with an increase in the time to judgment
FIGURE X Mexico, Juicios Ejecutivos: Characteristics associated with an increase in the time to judgment