Download
1 / 5
50 likes | 159 Views
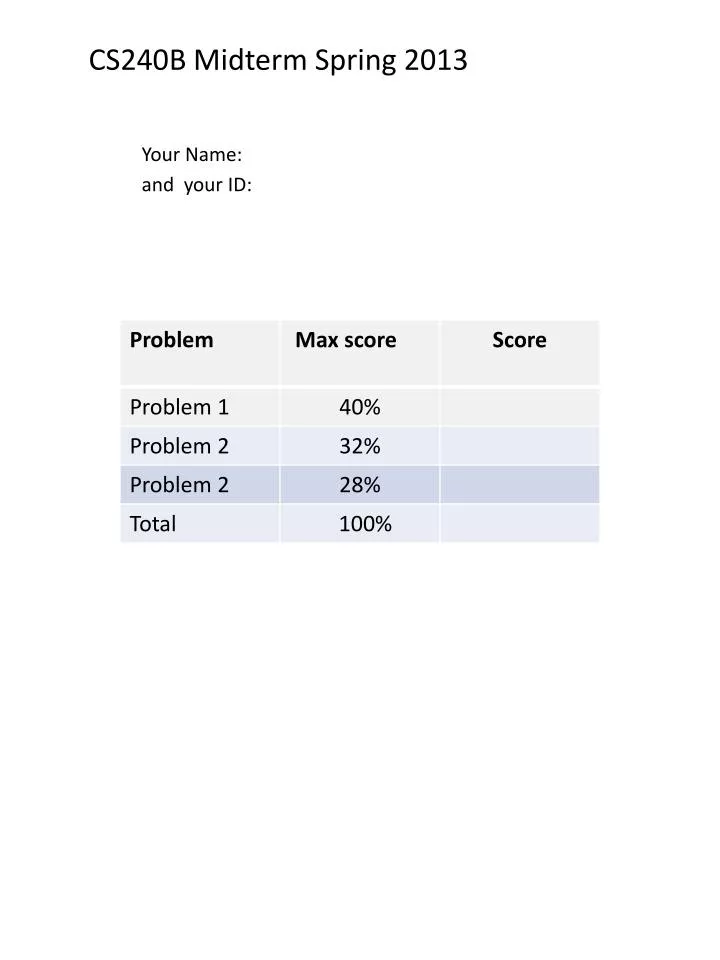
CS240B Midterm Spring 2013 Your Name: and your ID:. A. Source1. U. Source2. B. Problem 1. 40%. A1. S1. C. Sink. B2. S2.

E N D
A Source1 U Source2 B Problem 1. 40% A1 S1 C • Sink B2 S2 We have a steady-state situation. The number of tuples produced by A is the same as those in its input, but its output tuples are shorter and occupy half of the memory of its input . The same is true for B. Now A can process 1000 tuples per second, whereas B process 500 tuples per second. The union process 1000 tuples per second. Because of punctuation marks generated on demand there is no idle waiting. After processing other queries, the DSMS start processing this query graph where it finds N1 tuples in S1 and N2 tuples in S2. Q11: How long will the DMS take to finish processing these N1+N2 tuples (write an expression). N1(1+1+2.5) + N2(2+1+2.5)= N1*4.5+ N2*5.5. With no change for A and B, let us assume now that C can process 400 tuples per second. Also say that the DSMS tries to minimize memory using a Chain-like optimization approach. Q12: Under which input situation (i.e. values of N2 and N2, or perhaps their ratio) will the the average delay of the tuples increase significantly? Observe that one never breaks immediately after the union which is flat and the two paths are identical. Thus both path sees a memory release of one unit ever y 1+2.5=3.5 ms. Q13. Still assuming the chain-based memory optimization and no idle waiting, estimated the average delay for 10,000 tuples for the following three cases: Almost all tuples are in S1: Observe that processing tuples in A takes only 1ms. Much steeper path. The chain will break this path. The average delay for 10000 tuples in the buffer is: 10000*1+10000*3.5/2= 27500ms=27.5 sec. Almost all tuples are in S2: Here we have: 10000*2+10000*3.5/2= 27500ms=37.5 sec. (iii) half of the tuples are in S1 and the rest is in S2. A seemly correct answer is just take the average of the two 27.5/2+37.5/2 seconds. But the reality is that the chain is greedy and will process all the 5000 in S1 first and that takes 5000*1=5sec. Then the next steepest is B and that takes 5000*2=10sec. At this point, the 5000+5000 tuples are processed by U+C. This takes 10000*3.5=3.5 sec. So far no output. Then , the output begin and ends 35 sec later. Thus 5+10+35/2= 15+17.5= 32.5sec. Thus the delay increases with the increases with the S2/S1 ratio. Compare these numbers with the optimum average delay is 50/2= 25 sec Q14. Illustrate the various cases with diagrams (it might be easier to start from here, before you answer the other questions).
Problem 2: 32%We have a stream of tuples describing employee histories, such as those above. The tuples arrive ordered by their timestamps. We want to project out Title and produce coalesced tuples in the output.(Q21) write an SQL-TS query to do that (Q22) write an SQL-MR query to do that. SQL-TS SELECT empno, first(B.start), max(B.end) FROM Emp AS PATTERN (B+) PARTITION BY empno ORDER BY start WHERE NOT EXISTS (SELECT empnoAS cover FROMEmpWHEREcover.start<B.startANDcover.end >= B.start) AND ( count(B.empno)=1 OR max(previous(B.end)) >= B.start) So we begin with a period whose start is not covered by another Then we find a sequence of only one period and we continue while the next start is before the end of the still growing coalesced period.
Problem 2: 32%We have a stream of tuples describing employee histories, such as those above. The tuples arrive ordered by their timestamps. We want to project out Title and produce coalesced tuples in the output.(Q22) write an SQL-MR query to do that. SQL-MR SELECT empno, /*employee number*/ startTS , /*start of the next maximal period*/ endTS/*end of the current maximal period*/ FROM EmpMATCH_RECOGNIZE ( PARTITION BY empnoORDER BY start MEASURES B.empnoAS Eno, FIRST(B.start) ASstartTS, MAX(B.end) AS endTSONE ROW PER MATCH AFTER MATCH SKIP PAST LAST ROW /* a hole between periods*/ MAXIMAL MATCH PATTERN (B+) DEFINE B AS (B.empno =1) OR MAX(PREV(B.end))>= B.start )
Problem 3: 28% 3A We have a time-stamped data stream that begins at time TAlpha, and we can call SQL 2003 aggregates with UNLIMITE PRECEDING. We want to compute the COUNT on a sliding window of 80 minutes without using windows since they require too much memory. Write an ESL expression to do that. Say that we have union-merged the live stream and the one coming from disk. Thus we might have something like: SMstream(timestamp, IP, source) where source tells us if it is a live event or one from disk. The timestamp of events from disks has been incremented by 80 minutes. Also source=+1 denotes the original stream, wile source -1 denotes that this comes from disk. /* This counts alls the emails in a widnow of 80 minutes.*/ SELECT SUM (source) (UNLIMITED PRECEDING) FROM SMstream /*This counts alls the emails in a widnow of 80 minutes for each IP*/ SELECT SUM (source) (UNLIMITED PRECEDING) FROM SMstream 3B Now the input stream is filtered by a sampler that retains 5% of the input tuples and discard the rest. Is there an easy modification for query 3A that produces an accurate estimate for the exact count? Show and explain the modification. One should multiply by 100/5=20 the result. 3C Now we want to compute count_distinct. and also perform an accurate estimation for it. Explain why approaches similar to those used in 3A or 3B will not work well. E.g. if B contains N distinct items, a W of size N could just contain the same items or totally new ones. In the second case N+N is correct. In the first case it is not. Let U be the stream so far. W is the window, and B is the stream before W. If cntd denotes count distinct, in general cntd(B)+ cntd(W) can be quite different from cntd(U). 3D Another approach to estimate count_distinct, consists in (i) maintaining a fixed size sample on a window (e.g., using the BOZ technique discussed in class), (ii) compute the count_distinct value on this window, and (iii) scale-up the result according to the tuple count in the original window (this is known for physical windows and can be computed with technique 3A for logical ones). Would this approach produce reliable estimates? (Support your statements with formulas and examples.) Again there is no way to guess the correct value from that of the sample. For instance, we have 5% sampling and we see 10 distinct items. In the original window we might have 50 distinct items of just the 10 we observed, and the rest are repetitions.