Download
1 / 37
370 likes | 578 Views
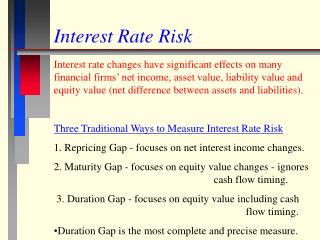
11-Interest Rate Risk. Review. Interest Rates are determined by supply and demand, are moving all the time, and can be difficult to forecast. The yield curve is generally upward sloping Interest Rate Risk: The uncertainty surrounding future interest rates.

E N D
Review • Interest Rates are determined by supply and demand, are moving all the time, and can be difficult to forecast. • The yield curve is generally upward sloping • Interest Rate Risk: The uncertainty surrounding future interest rates. • Unforeseen parallel shifts in the yield curve • Unforeseen changes in the slope of the yield curve Our Focus
Where We are Going • Dollar Gap • Method to understand the impact of interest rate risk on bank profits • Simple, and requires some ad-hoc assumptions • Not discussed in Bodie-Kane-Marcus • Duration • Method to understand the impact of interest rate risk on the value of bank shareholder equity • More elegant and mathematically intense • The focus of the reading in Bodie-Kane-Marcus • Used extensively as well by bond traders
Interest Rate Risk • Banks assets • Generally long-term, fixed rate • Bank liabilities • Generally short term, variable rate • Impact on profits: • Rates increase • Interest received stays fixed • Interest paid increases • Profits decrease
Interest-Rate Sensitive • An asset or liability whose rate is reset within some “short period of time” e.g. 0-30 days, 1-year, etc. • Interest rate sensitive assets: • Short-term bond rolled over into other short-term bonds • Variable rate loans • Interest rate sensitive liabilities: • Short-term deposits
Interest-Rate Risk Example • Assets: 50 billion • 5B IRS; rate = 8% per year • Liabilities: 40 billion • 24B IRS; rate = 5% per year • Profits ($billion) • 50(.08)-40*(.05) = 2
Parallel Shift in Yield Curve • Suppose all rates increase by 1% • Assets • IRS (5B): rate = 9% • Not IRS (45B): rate = 8% • Liabilities • IRS (24B): rate = 6% • Not IRS (16B): rate = 5%
Profits After Rate Increase • Interest Expenses ($billion) • 16(.05)+24(.06)=2.24 • Interest revenues ($billion) • 5*(.09)+45*(.08)=4.05 • Profits • Before: 2 billion • After:4.05-2.24=1.81 billion • Decrease: 0.19 billion or 9.5% drop in profits (1.81/2)-1=.095
Gap Analysis • Gap = IRSA – IRSL • IRSA = dollar value of interest rate sensitive assets • IRSL = dollar value of interest rate sensitive liabilities
Gap • From Previous Example • IRSA (millions) = 5 • IRSL (millions) = 24 • Dollar Gap (millions): 5 – 24 = -19 • Change in profits= Dollar Gap´Di • From previous example: • Change in profits (millions) -19 ´.01 = -0.19
Gap Analysis • If the horizon is long enough, virtually all assets are IRS • If the horizon is short enough, virtually all assets become non-IRS • No standard horizon
Dollar Gap Summary Dollar GAP Di DProfits Negative Increase Decrease Negative Decrease Increase Positive Increase Increase Positve Decrease Decrease Zero Either Zero
What is the right GAP? • One of the most difficult questions bank managers face • Defensive Management • Reduce volatility of net interest income • Make Gap as close to zero as possible • Aggressive Management • Forecast future interest rate movements • If forecast is positive, make Gap positive • If forecast is negative, make Gap negative
Problems with Gap • Time horizon to determine IRS is ambiguous • Ignores differences in rate sensitivity due to time horizon • Focus on profits rather than shareholder wealth
Building a Bank • Suppose you are in the process of creating a bank portfolio. • Shareholder equity: $25 million • You’ve raised $75M in deposits (liabilities) • You’ve purchased $100M in 30-yr annual coupon bonds (assets)
Assets 30-yr bonds FV: $100M Coupon rate: 1.8% YTM=1.8% Liabilities Deposits $75M Paying 1% per year Bank Equity and Interest Rates Annual profits: $1.8M - $0.75M = $1.05M Rate on bonds is fixed – no matter how rates change. Rate on deposits resets every year.
Gap Analysis • IRSA – IRSL = 0 – 75M = -75M • Assume rates increase by 10 basis points • We must now pay 1.1% on deposits • Change in profits: -75M(.001) = -75,000 • Profits down 7% = 75K/1.05M
Gap Analysis • One Solution: To protect profits from interest rate increases, sell your holdings in the long term bonds and buy shorter term bonds • But since yield curve is usually upward sloping (liquidity risk-premiums), shorter term bonds will usually earn lower yields. • Result: Lower profits
Manager’s Objective • Managers should probably not be concerned about protecting profits. • Instead, should be concerned about protecting value of shareholder equity: the value shareholders would get if they sold their shares.
Market Value of Bank Assets • Before Rates Increase: Assets =$100M • After rate increase? • Bank is earning 1.8% on 30-yr bonds • Other similar 30-year bonds are paying a YTM of 1.9% • Market value of bank assets: • N=30, YTM=1.9%, PMT=1.8M, FV=100M • Value = $97.73M
Market Value of Bank Liabilities • Liability of $75.75M due in one year • Principal and interest • Depositors will “redeposit” principal with you at new rate in 1-year • Market Value of liabilities = amount I would have to put away now at current rates to pay off liability in one year = present value • Before rates increase: 75.75/1.01=$75M • After rates increase: 75.75/1.011=$74.93M
Market Value of Equity • PV(assets) – PV(liabilities) • One way to think of it: • Assume 1 individual were to purchase the bank • After purchasing the bank she plans to liquidate • When she sells assets, she will get PV(assets) • But of these assets, she will have to set aside some cash to pay off liabilities due in 1 year, PV(liabilities)
Market Value of Equity • One way to think of it (continued) • When considering a purchase price, she shouldn’t pay more than PV(assets)-PV(liabilities) • But current shareholders also have the option to liquidate rather than sell the bank • Current shareholders shouldn’t take anything less than PV(assets) - PV(liabilities)
Interest Rates and Bank Equity • Before rates increase: equity=$25M • After rates increase: 97.73-74.93=$22.8M • Change in equity: 22.8M-25M = -2.2M • A 10 basis point increase in rates leads to a drop in equity of 8.8% (22.8/25-1=-.088)
Solutions • Sell long term bonds and buy short-term bonds • Problem: Many assets of banks are non-tradable loans (fixed term) – more on this later. • Some bank loans are tradeable: securitized mortgages • How much do we want to hold in long vs. short bonds? • Refuse to grant long-term fixed rate loans • Problem: No clients – no “loan generation fees” • Bank wants to act as loan broker
Solutions • What should be our position in long versus short-term bonds? • How much interest rate risk do we want? • Longer term bonds earn higher yields, but the PVs of such bonds are very sensitive to interest rate changes. • We need a simple way to measure the sensitivity of PV to interest rate changes.
PV and Yields PV y
Modified Duration • Duration: a measure of the sensitivity of PV to changes in interest rates: larger the duration, the more sensitive • Bank managers choose bank portfolio to target the duration of bank equity.
Duration and Change in PV • Let DPV = “change in present value” • The change in PV for any asset or liability is approximately
Example • From before: • Original PV of 30-year bonds: $100M • When YTM increased 10 bp, PV dropped to 97.73 • DPV=97.73M -100M = -2.27M • Duration Approximation
Example • From before: • Original PV of liabilities: $75M • When rate increased 10 bp, PV dropped to 74.93M • DPV=74.93M -75M = -0.074M • Duration Approximation
Example • Change in bank equity using duration approximation: • Before, the change in equity was -2.20.
Modified Duration • Modified Duration is defined as where “D” is called “Macaulay’s Duration”
Macaulay’s Duration • Let t be the time each cash flow is received (paid) • Then duration is simply a weighted sum of t • The weights are defined as
Example • Annual coupon paying bond • matures in 2 years, par=1000, • coupon rate =10%, YTM=10% • Price=$1000 • Time when cash is received: • t1=1 ($100 is received), t2=2 ($1100 is received) • weights:
Example • Macaulay’s Duration: • Modified Duration: