Download
1 / 14
140 likes | 230 Views
MICE Beam Loss vs Particle Rate. Adam Dobbs, ISIS Meeting, 18 th December 2009. Outline. Current Beamline Analysis Procedure Latest High Beam Loss (~5V) results Future Plans. Current MICE beamline. D = Dipole bending magnet Q = Quadrupole magnet

E N D
MICE Beam Loss vs Particle Rate Adam Dobbs, ISIS Meeting, 18th December 2009
Outline • Current Beamline • Analysis Procedure • Latest High Beam Loss (~5V) results • Future Plans A Dobbs
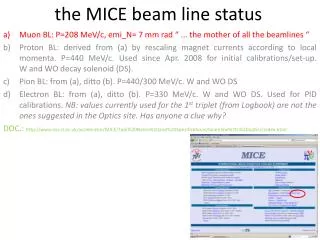
Current MICE beamline D = Dipole bending magnet Q = Quadrupole magnet DS = Decay solenoid DSA = Decay Solenoid Are a GVA1 = Scintillator counter CKOV = Cherenkov detector BM = Beam Profile Monitor TOF = Time of Flight Target Q1-3 D1 D2 Q4-6 BM2 Q7-9 ISIS DSA MICE Hall DS GVA1 BM1 TOF0 CKOV A, B TOF1 A Dobbs
Beam Loss vs Particle Rate Flow Diagram Target DAQ data DATE DAQ data Data Reduction 1 – fitted peak beam loss analysis, etc Particle rate data extraction with ScalersAnalysis Reduced Beam Loss data Particle Rate data Combine data by matching time stamps Combined data (ROOT files) Data reduction 2: extract means and sigmas for variables on a run-by-run basis Final plots of beam loss vs particle rate A Dobbs
Results One point = the mean values of the beam loss and particle rate for a run A Dobbs
Future Plans • Another high beam loss study planned for December machine physics period • Reproducibility • Better statistics (400 – 500 pulses per setting) • Use ToF data • Another rate counter • PID • Compare with G4BeamLine simulations A Dobbs
Preliminary ToF Data for Run 1231 • Produced using G4MICE/TofMonitor π e µ A Dobbs
Analysis Procedure Step I.I – Beam Loss Target DAQ data Reduced Beam Loss data • Initially for each target dip a whole spectrum of data is present for each variable (black sample spectra shown above). Canonical single values for each variable are calculated from the spectra using BLA Part 2 to given one value for each variable per target dip (fits doing this shown in red). These are written to an ascii file. A Dobbs
Analysis Procedure Step I.II- Particle Rate • Held in DATE data stream i.e. in binary • Contains GVA1, BM1, BM2, various TOF0 and TOF1 data • Extracted using a modified version of G4MICE ScalersAnalysis application • Output is an ascii file containing the number of hits for each detector per spill (i.e. per target dip) • TOF data harder to interpret DATE DAQ data Particle Rate data A Dobbs
Analysis Procedure Step II- Combine the data • Once the beam loss and particle rate data has been converted to ascii files containing values for each target dip, the data from the two streams must be combined • Data are synchronised using timestamps associated with each target dip data set (the clocks of the two DAQs are synched) • -> Leads to combined data set holding both beam loss and particle rate data per target dip Reduced Beam Loss data Particle Rate data Combined data (ROOT files) A Dobbs
Analysis Procedure Step III- extract mean values per run and plot • A combined data file is produced for each run • This file is processed using ROOT to calculate the mean and sigma of each value for a run (a second data reduction) e.g. the mean of GVA1, the mean summed beam loss in sector 7 • The values are finally plotted for a series of runs, each having a different nominal beam loss value, but with all other parameters (e.g. Optics) held constant Combined data (ROOT files) Final plots of beam loss vs particle rate A Dobbs
Histogramme of GVA1 rate per target dip, for run 1231 One of the better fits! A Dobbs